
Help Center/ Application Operations Management/ User Guide (2.0)/ Prometheus Monitoring/ Checking Prometheus Instance Data Through Grafana
Updated on 2026-01-29 GMT+08:00
Checking Prometheus Instance Data Through Grafana
After connecting a cloud service or CCE cluster to a Prometheus instance, you can use Grafana to view the metrics of the cloud service or cluster.
Prerequisites
- You have created an ECS.
- You have created an EIP and bound it to the created ECS. For details, see Elastic Cloud Server (ECS) Getting Started.
- Your service has been connected for Prometheus monitoring. For details, see Managing Prometheus Instances.
Procedure
- Install and start Grafana. For details, see the Grafana official documentation.
- Add an access code.
- Log in to the AOM 2.0 console.
- In the navigation pane, choose Settings. The Global Settings page is displayed.
- On the displayed page, choose Authentication in the navigation pane. Click Add Access Code.
- In the dialog box that is displayed, click OK. The system then automatically generates an access code.
An access code is an identity credential for calling APIs. A maximum of two access codes can be created for each project. Keep them secure.
- Obtain the Grafana data source configuration code.
- Log in to the AOM 2.0 console.
- In the navigation pane on the left, choose Prometheus Monitoring > Instances. In the instance list, click the target Prometheus instance.
- On the displayed page, choose Settings in the navigation pane and obtain the Grafana data source information from the Grafana Data Source Info area.
- Configure Grafana.
- Log in to Grafana.
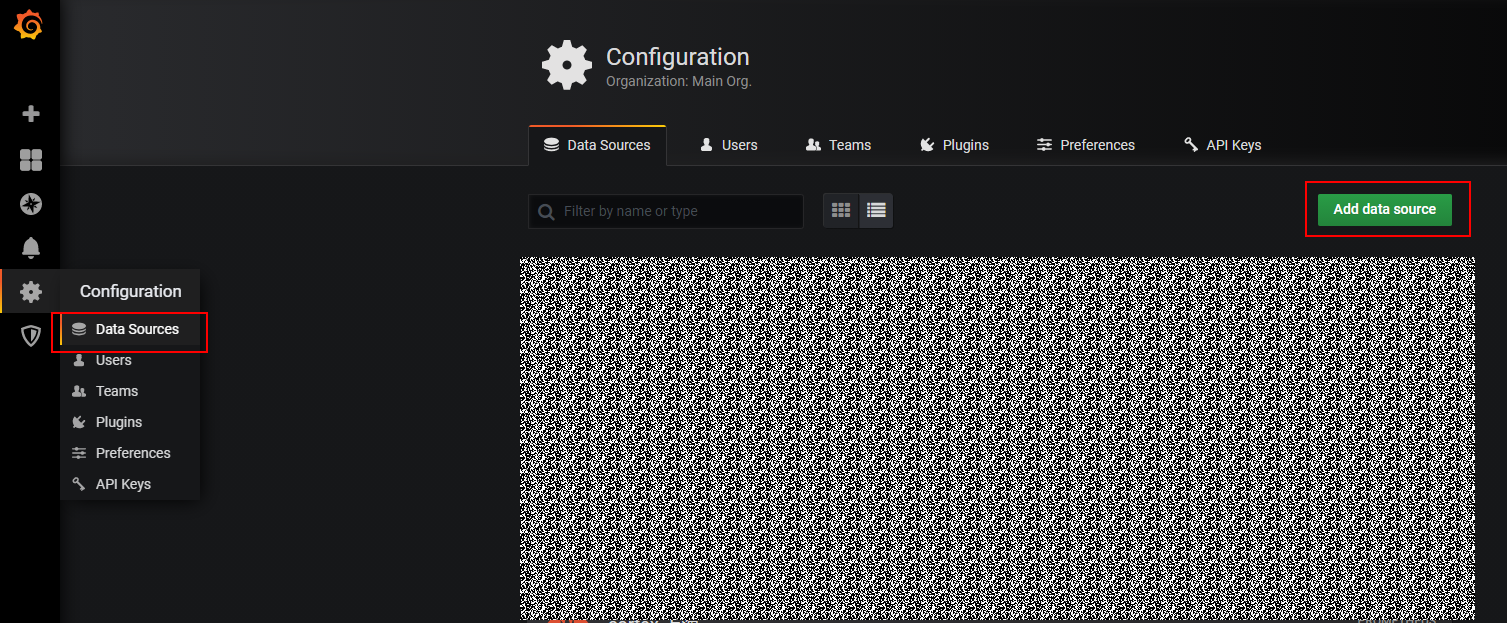
- In the navigation pane, choose Configuration > Data Sources. Then click Add data source. Figure 1 Configuring Grafana
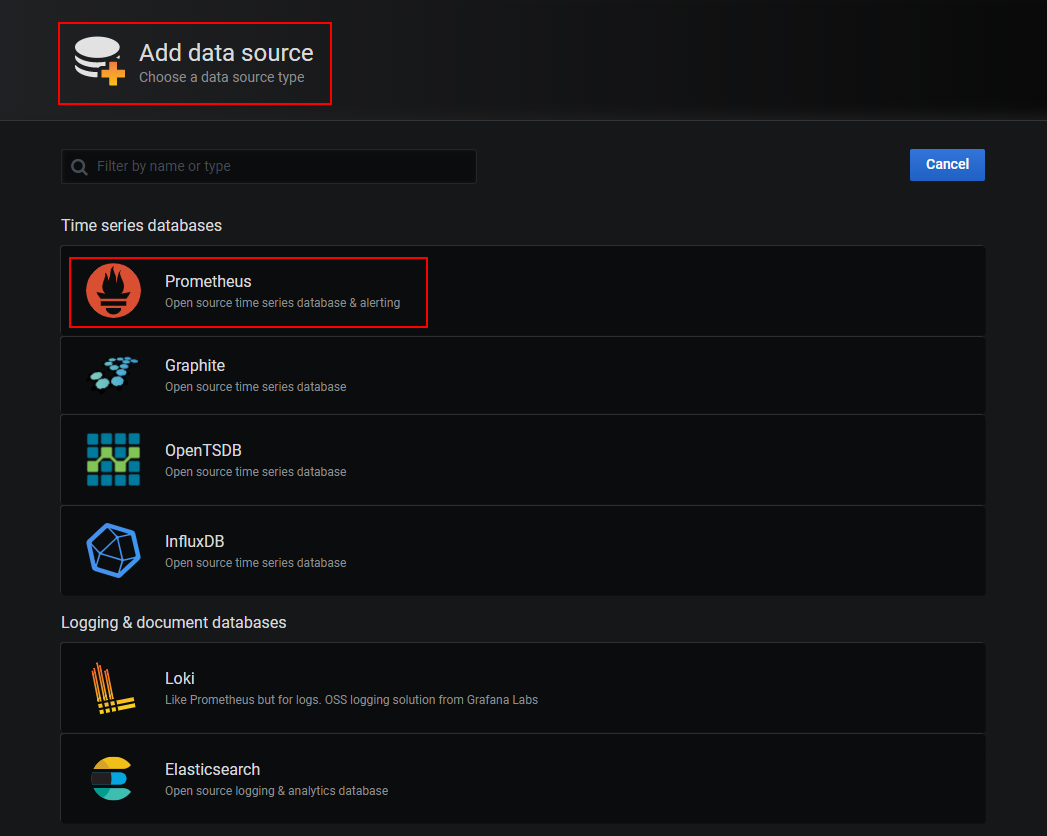
- Click Prometheus to access the configuration page. Figure 2 Prometheus configuration page
- Set Grafana data source parameters.
The Basic auth and Skip TLS Verify options under Auth must be enabled.
Figure 3 Setting parameters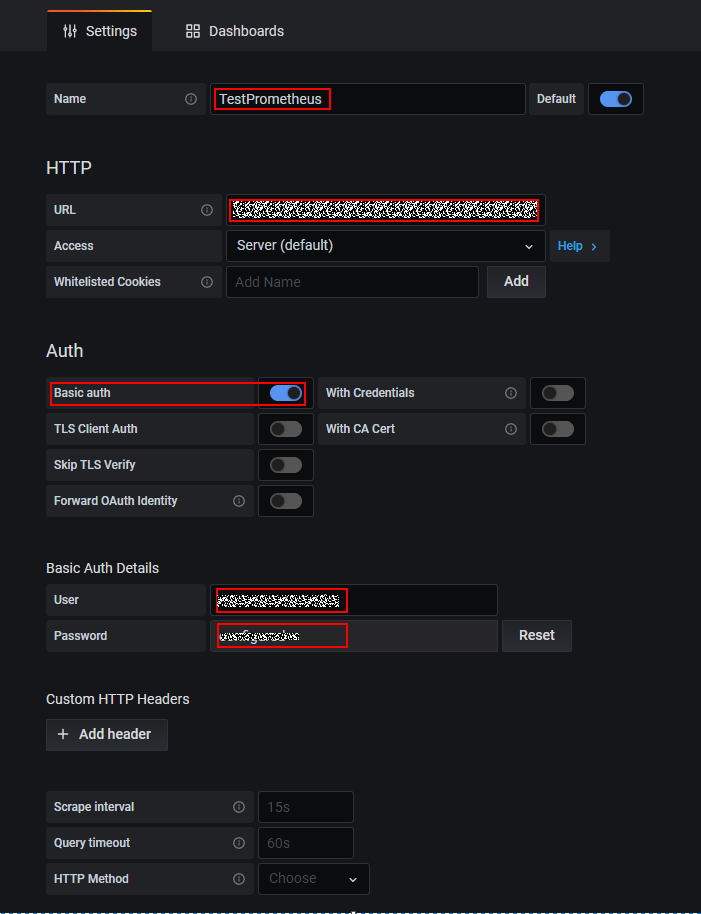
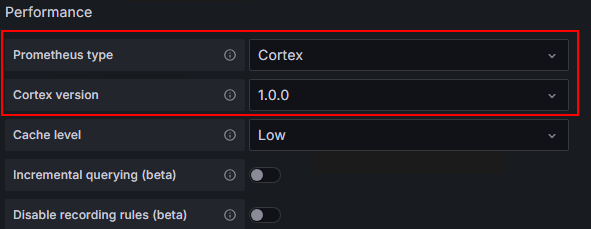
If the current version supports the configuration of performance parameters under Advanced settings, set Prometheus type to Cortex and Cortex version to 1.0.0.
- Click Save&Test to check whether the configuration is successful.
If the configuration is successful, you can use Grafana to configure dashboards and view metric data.
Figure 4 Checking whether the configuration is successful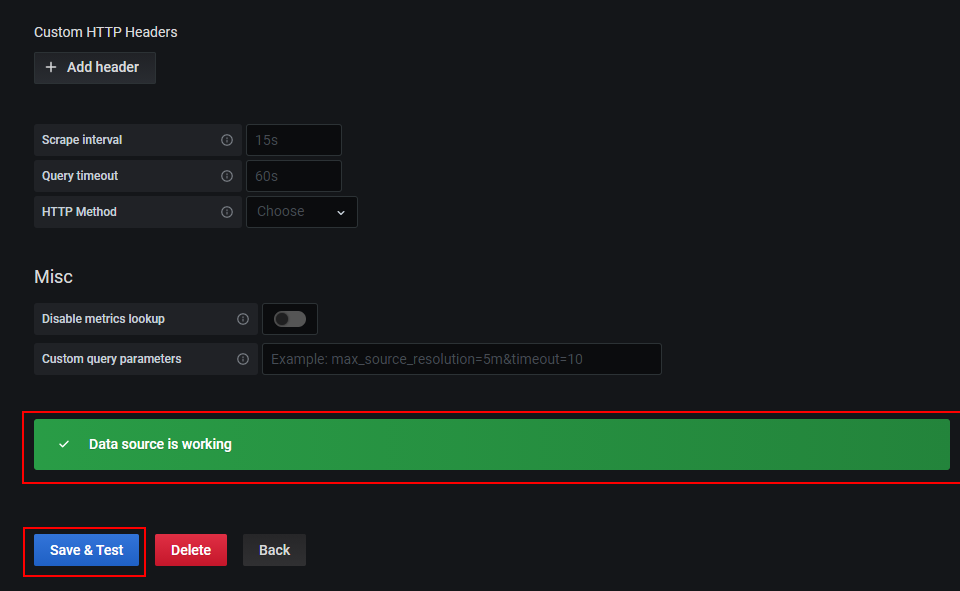
Parent topic: Prometheus Monitoring
Feedback
Was this page helpful?
Provide feedbackThank you very much for your feedback. We will continue working to improve the documentation.
The system is busy. Please try again later.


