
Updated on 2025-08-07 GMT+08:00
Viewing Monitoring Reports
On the Anti-DDoS console, you can view the monitoring details of a specified EIP. This includes the current protection status, protection settings, and traffic and abnormal events within the last 24 hours.
Viewing a Monitoring Report
- Log in to the Anti-DDoS console.
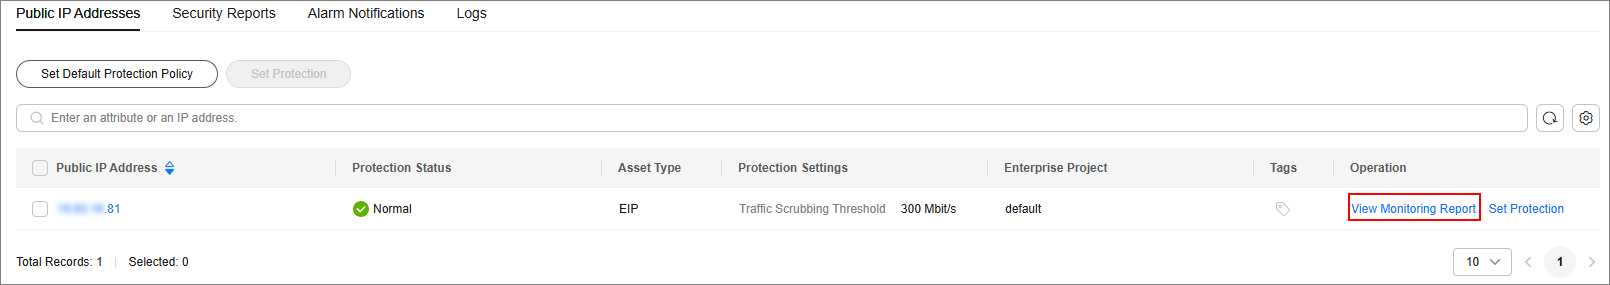
- Click the Public IP Addresses tab, locate the row that contains the IP address of which you want to view its monitoring report, and click View Monitoring Report. Figure 1 Viewing a monitoring report
- On the Monitoring Report page, view monitoring details about the public IP address.
- You can view information such as the current defense status, current defense configurations, traffic within 24 hours, and abnormalities within 24 hours.
- A 24-hour defense traffic chart is generated from data points taken in five-minute intervals. It includes the following information:
- Traffic displays the traffic status of the selected ECS, including the incoming attack traffic and normal traffic.
- Packet Rate displays the packet rate of the selected ECS, including the attack packet rate and normal incoming packet rate.
- The attack event list within one day records DDoS attacks on the ECS within one day, including cleaning events and black hole events.
Figure 2 Viewing a traffic monitoring report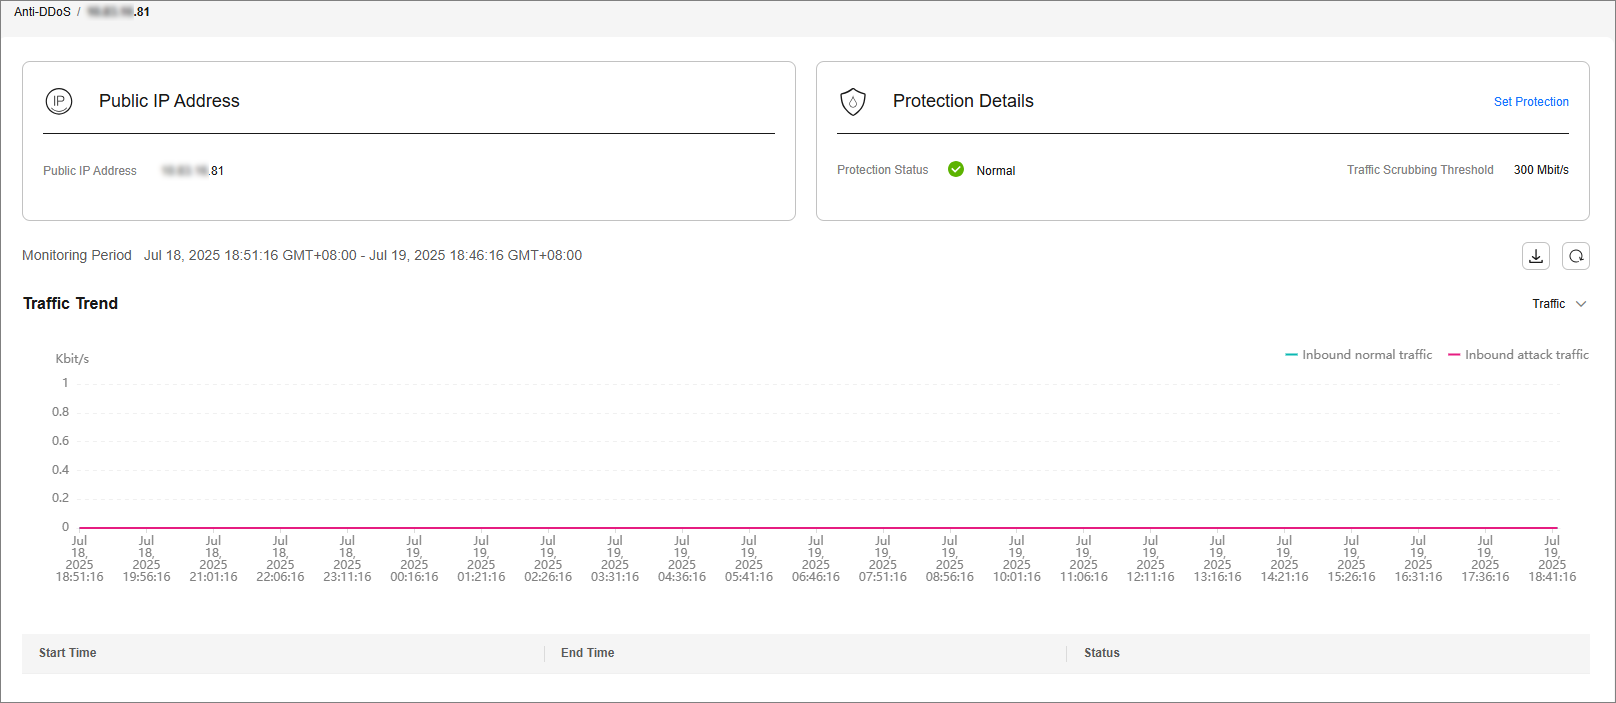 Figure 3 Viewing the packet rate
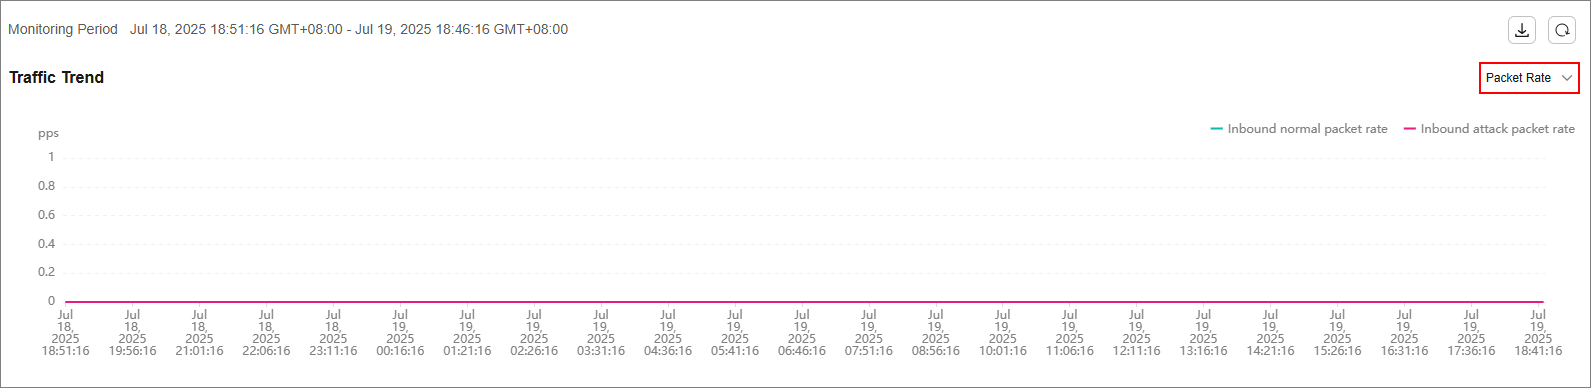

Click
 to download monitoring reports to view monitoring details about the public IP address.
Feedback
Was this page helpful?
Provide feedbackThank you very much for your feedback. We will continue working to improve the documentation.
The system is busy. Please try again later.


