Monitoring a Real-Time Job
In the real-time processing mode, data is processed in real time, which is used in scenarios with high real-time performance. This type of job is a pipeline that consists of one or more nodes. You can configure scheduling policies for each node, and the tasks started by nodes can keep running for an unlimited period of time. In this type of job, lines with arrows represent only service relationships, rather than task execution processes or data flows.
You can choose Monitor Job and click the Real-Time Job Monitoring tab to view the job status, start time, and end time, and perform the operations listed in Table 1.

| No. | Operation | Description |
|---|---|---|
| 1 | Filtering jobs by Job Name, Owner, CDM Job, or Node Type | N/A |
| 2 | Filtering jobs based on the job status or job tag | N/A |
| 3 | Perform operations on jobs in a batch | Select jobs and perform batch operations on them, including starting, stopping, and adding tags to them. |
| 4 | Viewing job instance status | Click job in front of the |
| 5 | Job status-related operations | In the Operation column of a job, you can start, pause, recover, stop, rerun, and add tags to it. |
| 6 | Adding a job tag | Click Add Job Tag. The dialog box is displayed. |
| 7 | Viewing node information of a job | Click a job name. On the displayed page, click a node to view its associated job/scripts and monitoring information. NOTE: If event-driven scheduling is configured for a node in the job, the subjob monitoring page is displayed when you click the node. |
| 8 | Disabling and restoring a node | Click a job name. On the displayed page, right-click a node and select Disable. After the node is disabled, you can right-click it and select Restore to restore it on another location. For details, see Real-Time Job Monitoring: Disabling and Restoring a Node. |
| 9 | Viewing the boot log | Click a job name. On the displayed page, right-click a node and select View Run Log to view logs of the node. |
| 10 | Configuring scheduling | Click a job name. On the displayed page, right-click the node where event-driven scheduling is configured and select Configure Scheduling to modify the scheduling information about the node. For details, see Real-Time Job Monitoring: Configuring Scheduling for a Node Where Event-driven Scheduling Is Configured. |
| 11 | Clearing stream messages | Click a job name. On the displayed page, right-click the node where event-driven scheduling is configured and select Clear Stream Message. |
| 12 | Viewing logs | For real-time processing single-task Flink SQL and Flink JAR jobs, you can Click More and select View Log to view the logs of the jobs. NOTE: This function is unavailable if the MRS cluster version is not supported. |
Click a job name. On the displayed page, view the job parameters, properties, and instances.
Click a node of a job to view the node properties, script content, and node monitoring information. On the Nodes tab page, you can view the run logs of the real-time job.
In addition, you can view the current job version and status, start, rerun, and develop jobs, determine whether to display metric monitoring, and set the job refresh frequency.
Real-Time Job Monitoring: Disabling and Restoring a Node
You can disable a node in a real-time job and restore it in another location.
- Log in to the DataArts Studio console by following the instructions in Accessing the DataArts Studio Instance Console.
- On the DataArts Studio console, locate a workspace and click DataArts Factory.
- In the left navigation pane of DataArts Factory, choose .
- On the Real-Time Job Monitoring tab page, click a job name.
- On the displayed page, right-click the node and select Disable.
- Right-click the node and choose Resume from the shortcut menu. The Resume Node Running dialog box is displayed, as shown in Table 2.
Table 2 Resumption parameters Parameter
Description
Last Paused
Start time when a node is suspended.
Tasks Not Run
Number of tasks that are not running during node suspension.
Run From
Parameters for performing the tasks generated during the pause period.
Position from which running restarts.
- Paused node
- The first node of the subjob
Concurrent Tasks
Parameters for performing the tasks generated during the pause period.
Number of tasks to be processed.
Task Name
Parameters for performing the tasks generated during the pause period.
Task to be resumed.
Real-Time Job Monitoring: Configuring Scheduling for a Node Where Event-driven Scheduling Is Configured
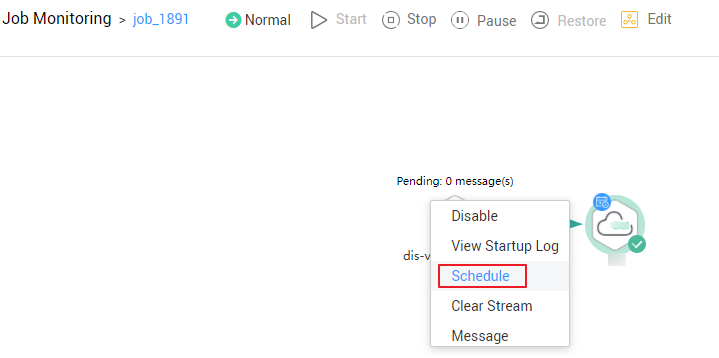
If event-driven scheduling is configured for a node in a real-time job, right-click the node on the job monitoring details page and choose Configure Scheduling from the shortcut menu to view and modify the scheduling information about the node.
- Log in to the DataArts Studio console by following the instructions in Accessing the DataArts Studio Instance Console.
- On the DataArts Studio console, locate a workspace and click DataArts Factory.
- In the left navigation pane of DataArts Factory, choose .
- On the Real-Time Job Monitoring tab page, click a job name.
- On the displayed page, right-click the node where event-driven scheduling is configured, select Configure Scheduling, and configure the parameters shown in Table 3. Figure 2 Configuring scheduling

Table 3 Policy parameters Parameter
Description
Concurrent Events
Number of jobs that can be concurrently processed. The maximum number of concurrent events is 10.
Event Detection Interval
Interval for event detection. The unit of the interval can be Seconds or Minutes.
Failure Policy
Select a policy to be performed after scheduling fails.
- Stop scheduling
- Ignore failure and proceed
Feedback
Was this page helpful?
Provide feedbackThank you very much for your feedback. We will continue working to improve the documentation.


