Viewing Slow DN Instances of DWS
On the instance monitoring page, you can view real-time and historical information about slow instances. (If the period of an instance exceeds 240 seconds, the instance is reported as a slow instance.)
Instance Monitoring
- Log in to the DWS console.
- Choose Dedicated Clusters > Clusters and locate the cluster to be monitored.
- In the Operation column of the target cluster, click Monitoring Panel.
- In the navigation pane on the left, choose Monitoring > Instance Monitoring.
Slow Instance Detection
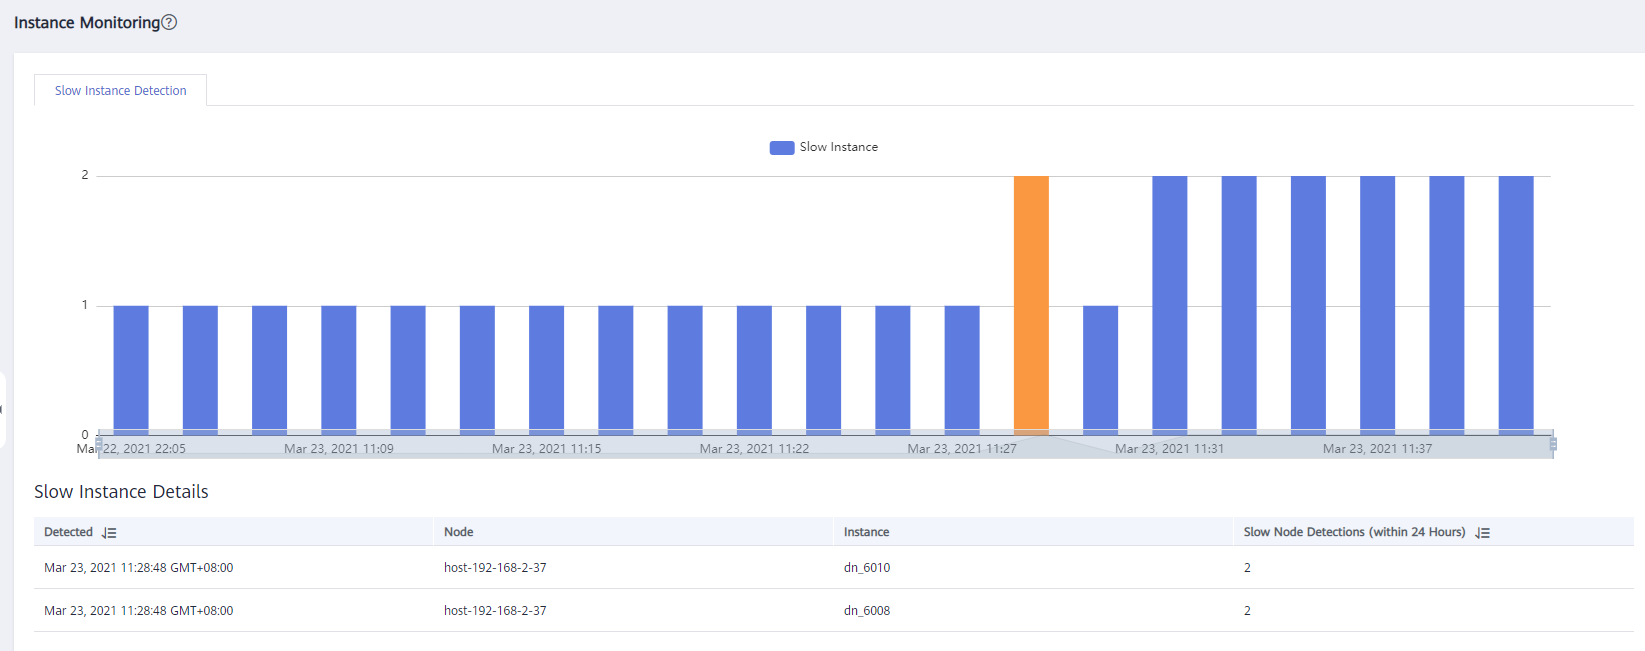
DMS can automatically configure and start the slow instance detection script on cluster CNs, periodically collect the cache table of the script, and report the detected slow instance data. You can view the number of slow instances detected within 24 hours and the distribution status in the time dimension on the GUI to quickly locate the slow nodes in the cluster and analyze the root causes.
The Instance Monitoring page consists of two parts. The upper part displays the time distribution chart of detected slow instances, that is, the number of slow instances detected in different detection periods. The lower part displays slow instance details. When you select any bar in the time distribution chart, details about the detection time, node name, instance name, and number of detections (within 24 hours) of slow instances are displayed.

Feedback
Was this page helpful?
Provide feedbackThank you very much for your feedback. We will continue working to improve the documentation.


