

文档首页/
AI开发平台ModelArts/
最佳实践/
LLM大语言模型推理/
LLM大语言模型推理历史版本文档/
主流开源大模型基于Lite Server&Cluster适配Ascend-vLLM PyTorch NPU推理指导(6.5.905)/
推理服务性能评测/
获取模型推理的Profiling数据
更新时间:2025-06-23 GMT+08:00
获取模型推理的Profiling数据
Profiling数据是程序运行过程中收集到的系统资源(如CPU、内存、磁盘 I/O等)的使用情况、程序的运行时间、函数的调用频率等数据,以发现系统性能瓶颈,优化程序代码和系统配置。
目前支持两种获取Profiling数据的方法,分别是通过LLM对象的start_profile、stop_profile接口和offline_profile.py脚本。
Profiling结果的格式是TensorBoard格式,可通过TensorBoard工具查看。
通过start_profile和stop_profile方法获取Profiling数据
通过指定环境变量VLLM_TORCH_PROFILER_DIR确定Profiling数据存放路径,开启Profiling功能。
例如:export VLLM_TORCH_PROFILER_DIR=".torch_profile",指定将Profiling结果存放在当前目录的 .torch_profile目录下。
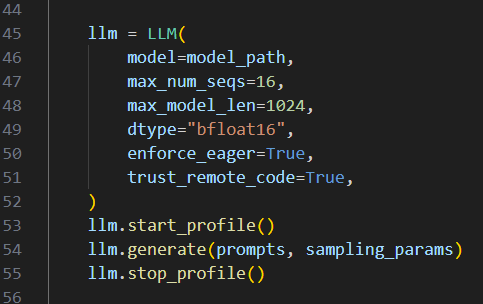
初始化LLM对象,调用start_profile,stop_profile,中间是任何想profile的操作。
通过offline_profile.py脚本获取Profiling数据
脚本路径是:tools/llm_evaluation/benchmark_tools/offline_profile.py
脚本参数:
- --save-path:Profiling结果存放路径,默认是".torch_profile"。
- --prefill:收集prefill过程的数据。
- --decode:收集decode过程的数据。
- --with-stack:记录调用堆栈。
- --with-modules:记录模块层级。
- --record-shapes:记录input shape和input type。
- --profile-memory:记录内存使用。
- --profiler-level:日志记录层次。字符串类型,三个有效值 "level0"、"level1"、"level2",默认为level1。
"level0: Collects upper-layer application data, lower-layer NPU data (Ascend Headware data), and information about operators executed on the NPU.\n"
"level1: On the basis of Level0, collect Ascend CL data at the CANN layer and AI Core performance indicators executed on the NPU, and enable aic_metrics=torch_npu.profiler.AiCMetrics.PipeUtilization.\n"
"level2: Collect GE and Runtime data, HCCL and AI CPU data at the CANN layer, and enable aic_metrics=torch_npu.profiler.AiCMetrics.PipeUtilization on the basis of Level1."
- --prompt-len:prompt长度,默认256。
- --batch-size:默认1。
- --output-len:输出长度,默认5。
- --temperature:浮点数,默认0。
- --top-p:浮点数,默认0.8。
- --top-k:默认20。
- --repetition-penalty,默认1。
请求示例:
python tools/llm_evaluation/benchmark_tools/offline_profile.py \
--save-path .torch_profile \
--model /nfs-data/model/nlp/Qwen2/Qwen2-0.5B/ \
--record-shapes  \
--with-stack  \
--with-modules  \
--output-len 118 \
--prefill \
--decode  \
--enforce-eager
父主题: 推理服务性能评测


