更新时间:2025-05-29 GMT+08:00
如何评估VACUUM清理速率或需要清理多久
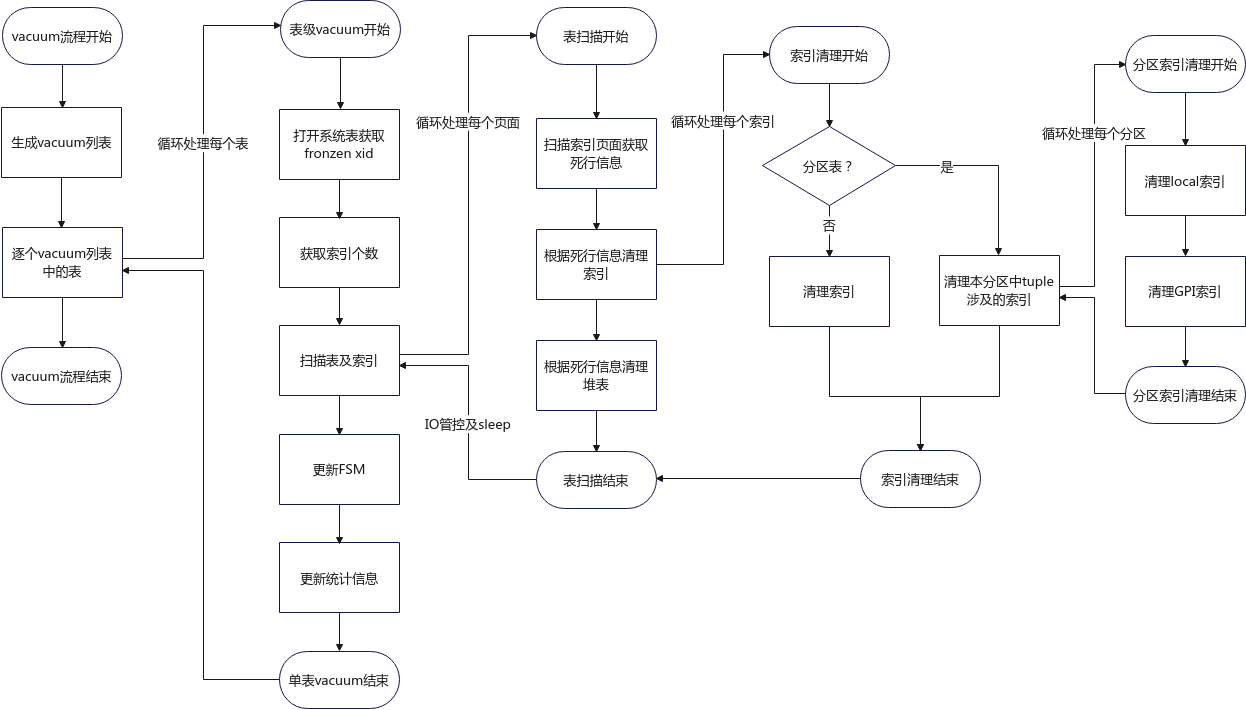
AUTOVACUUM的执行分为若干步骤,各个步骤的执行耗时各不相同,其流程简化如下:
图1 VACUUM流程图


从上图可以看出,VACUUM单表的耗时主要与以下几个因素相关:表页面数量、索引页面数量、全局索引个数、分区数量、IO管控时间。
单表VACUUM速度的估算公式如下:
- 非分区表
清理时间 = 页面数量 * 清理耗时 + 页面数量 / 评估代价 * 休眠时间
清理速度 = 死行总数 / 清理时间
- 分区表
页面数量= 数据页数量 + 普通索引页面数量 + (全局索引页面数量之和) * 分区数量
清理时间 = 页面数量 * 清理耗时 + 页面数量 / 评估代价 * 休眠时间
清理速度 = 死行总数 / 清理时间
可以通过以下SQL语句对单表的VACUUM速度进行评估:
- 非分区表:
select
((heap_pages * prune_time) + (index_pages * prune_time) * nindexs + ((heap_pages+index_pages) * hit_percent * Vacuum_cost_page_hit + (heap_pages+index_pages) * miss_percent * Vacuum_cost_page_miss + (heap_pages+index_pages) * dirty_percent * Vacuum_cost_page_dirty) * Vacuum_cost_delay / Vacuum_cost_limit) as totaltime, deadtuples/totaltime as speed
from
(select relpages as heap_pages,  b.n_dead_tup as deadtuples, b.n_dead_tup/(reltuples+b.n_dead_tup +1) as dirty_percent from pg_class a, pg_stat_all_tables b where a.relname = 't1' and b.relname = a.relname) as abc , (select sum(relpages) as index_pages, count(*) as nindexs from pg_class where relname in (select indexname from pg_indexes where tablename = 't1') and relkind = 'i') as bcd , (select 0.07 as prune_time, 0.05 as miss_percent , 0.95 as hit_percent , 1 as Vacuum_cost_page_hit,10 as Vacuum_cost_page_miss , 200 as Vacuum_cost_limit ,20 as Vacuum_cost_delay , 20 as Vacuum_cost_page_dirty);
- 分区表:
select
((heap_pages * prune_time) + (local_index_pages * prune_time) * nlocalindexs + (gpi_index_pages * prune_time) * npartitions * ngpiindexs + ((heap_pages + local_index_pages + gpi_index_pages) * hit_percent * Vacuum_cost_page_hit + (heap_pages + local_index_pages + gpi_index_pages) * miss_percent * Vacuum_cost_page_miss + (heap_pages + local_index_pages + gpi_index_pages) * dirty_percent * Vacuum_cost_page_dirty) * Vacuum_cost_delay / Vacuum_cost_limit) as total_time,
 dead_tuples/total_time as speed
 from
 (select relpages as heap_pages, b.n_dead_tup as dead_tuples, b.n_dead_tup/(reltuples+b.n_dead_tup+1) as dirty_percent from pg_class a, pg_stat_all_tables b where a.relname = 't1' and b.relname = a.relname) as abc ,
 (select sum(relpages) as local_index_pages,
 count(*) as nlocalindexs
 from
 pg_class where oid in (select indexrelid from pg_index where indrelid=(select oid from pg_class where relname = 't1')) and relkind='i') as bcd , (select sum(relpages) as gpi_index_pages, count(*) as ngpiindexs  from pg_class where oid in (select indexrelid from pg_index where indrelid=(select oid from pg_class where relname = 't1')) and relkind='I') as fenqu , (select count(*) as npartitions from pg_partition where parentid in (select oid from pg_class where relname = 't1'))as qqq ,(select 0.07 as prune_time, 0.05 as miss_percent , 0.95 as hit_percent , 1 as Vacuum_cost_page_hit,10 as Vacuum_cost_page_miss , 200 as Vacuum_cost_limit ,20 as Vacuum_cost_delay , 20 as Vacuum_cost_page_dirty) as yyy;

- 公式中prune_time为清理一个tuple需要的时间,这个值与硬件I/O能力相关,在SSD硬盘可以按照0.07ms进行估算。对于IO能力更强的NVMe硬盘,可以适当降低该值;而对于I/O能力较弱的机械硬盘,则需要适当提高;
- miss_percent和hit_percent是缓存命中情况。在刚导入数据的场景,缓存命中较低;在系统稳定后,可以按照miss 0.5和hit 0.95进行估算;
- vacuum_cost_delay是GUC参数autovacuum_vacuum_cost_delay的值。
除此之外,在当前版本中,我们引入了如下的进度分析视图,可以获取当前的AUTOVACUUM进度以及效率。
gaussdb=# select * from gs_stat_progress_vacuum(140123447490304);
       pid       | dataname | relid | relname |     phase     |
         detail
-----------------+----------+-------+---------+---------------+---------------------------------------------------------------------------------------------------
---------------------------------------------------------------------------------------------------------------------------
 140123447490304 | postgres | 24602 | t1      | scanning heap | vacuum db "postgres" starts at 2025-02-09 14:10:17.863838-05, vacuumed 12/242 relations, current r
elation "t1"; heap: scanned 55298/73216 blocks, skipped 0 blocks; info: found 0 dead tuples, already run 610s, delay 608s.
(1 row)
父主题: 常见问题


