Creating a Data Report
You can create data reports and use widgets such as pie charts, bar charts, and totals to show data in different ways. This helps you check, study, and sum up the data.
Prerequisites
You have created a form and filled in data. For example, the supplier list form has collected the following 12 records.

Creating a Data Report
- Log in to the no-code workbench by referring to Logging In to the No-Code Workbench.
- In All Apps, hover over the target application's … and choose Edit.
- In the upper right corner of the page, click Check Statistics.
Figure 2 Clicking Check Statistics

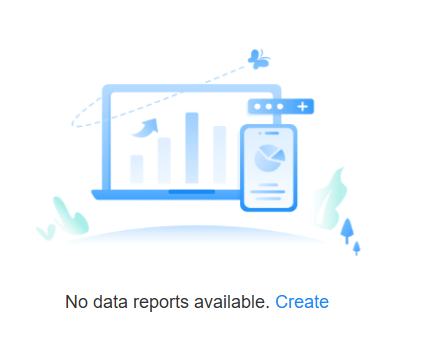
- If no report has been created, the page shown in Figure 3 is displayed. Click Create.
- Configure the report.
- In the upper left corner of the page, set the report name.
Figure 4 Setting the report name
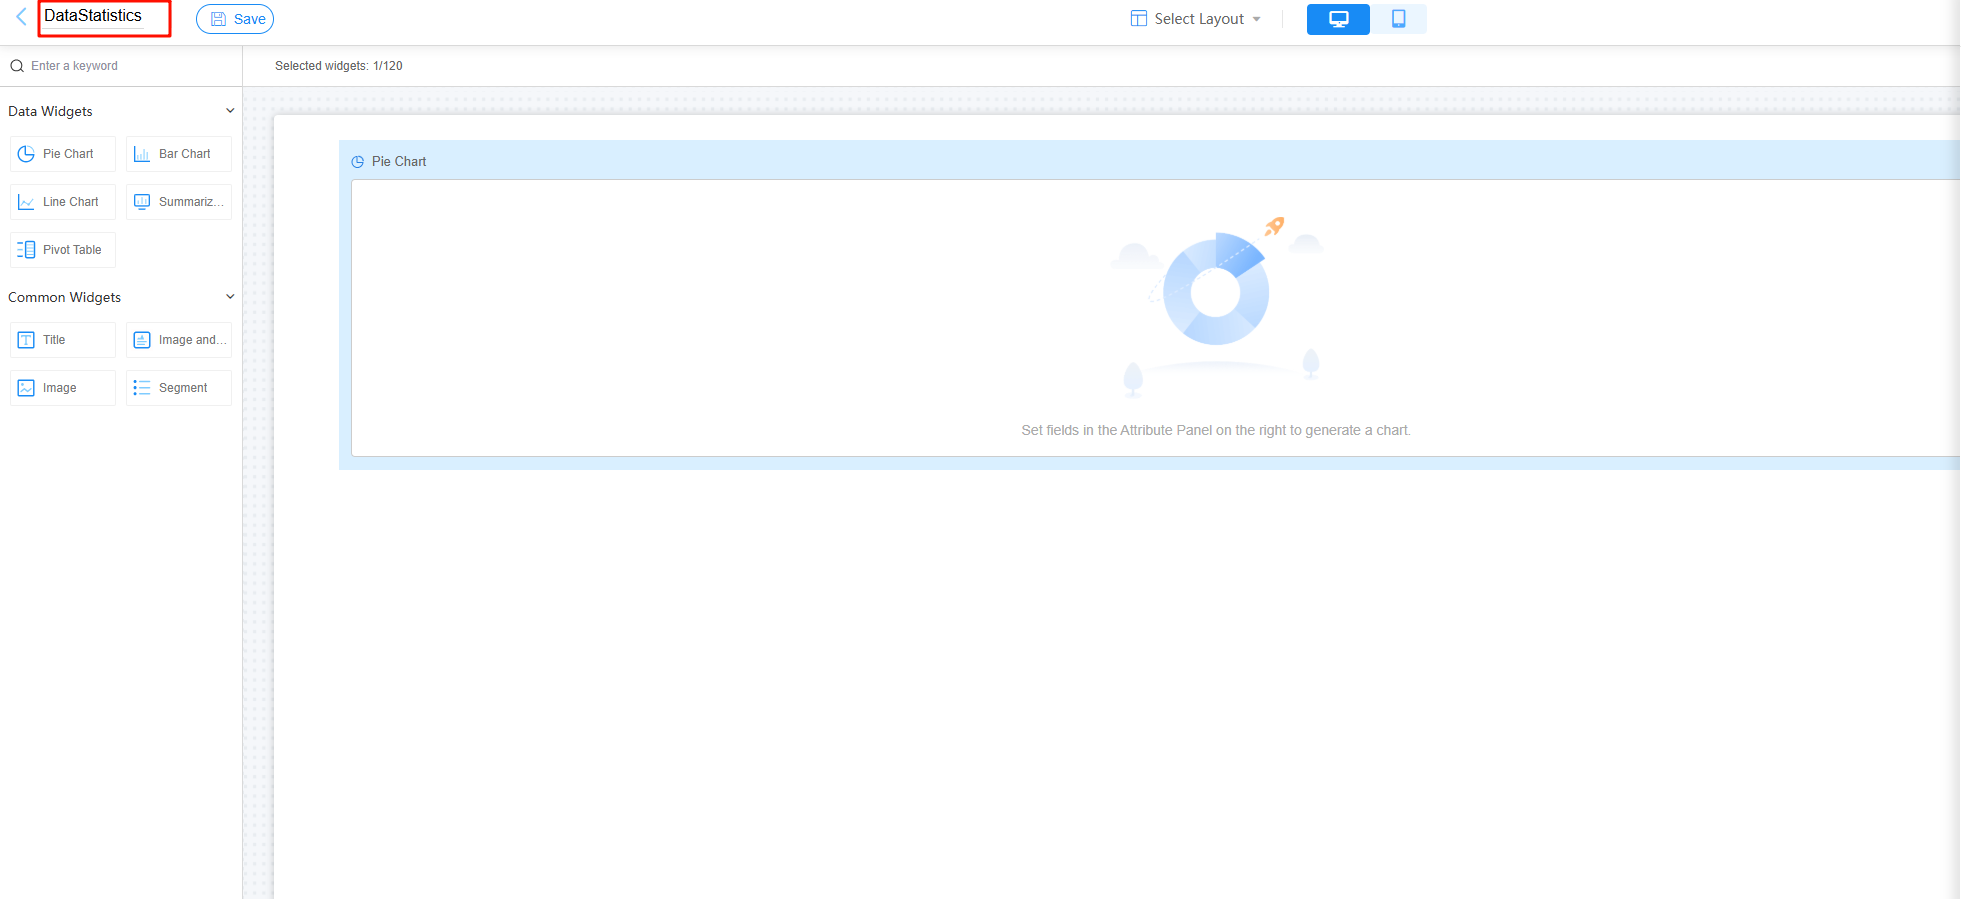
- In the upper middle of the page, click Select Layout to select the desired form layout.
Figure 5 Selecting a layout

- In the upper middle area, select a terminal view type.
Choose PC or mobile view so the process works best on each device.
- Drag a widget from the left pane to the middle area by referring to Adding Widgets to a Report, and set widget properties by referring to Setting the Properties of Widgets on Data Reports.
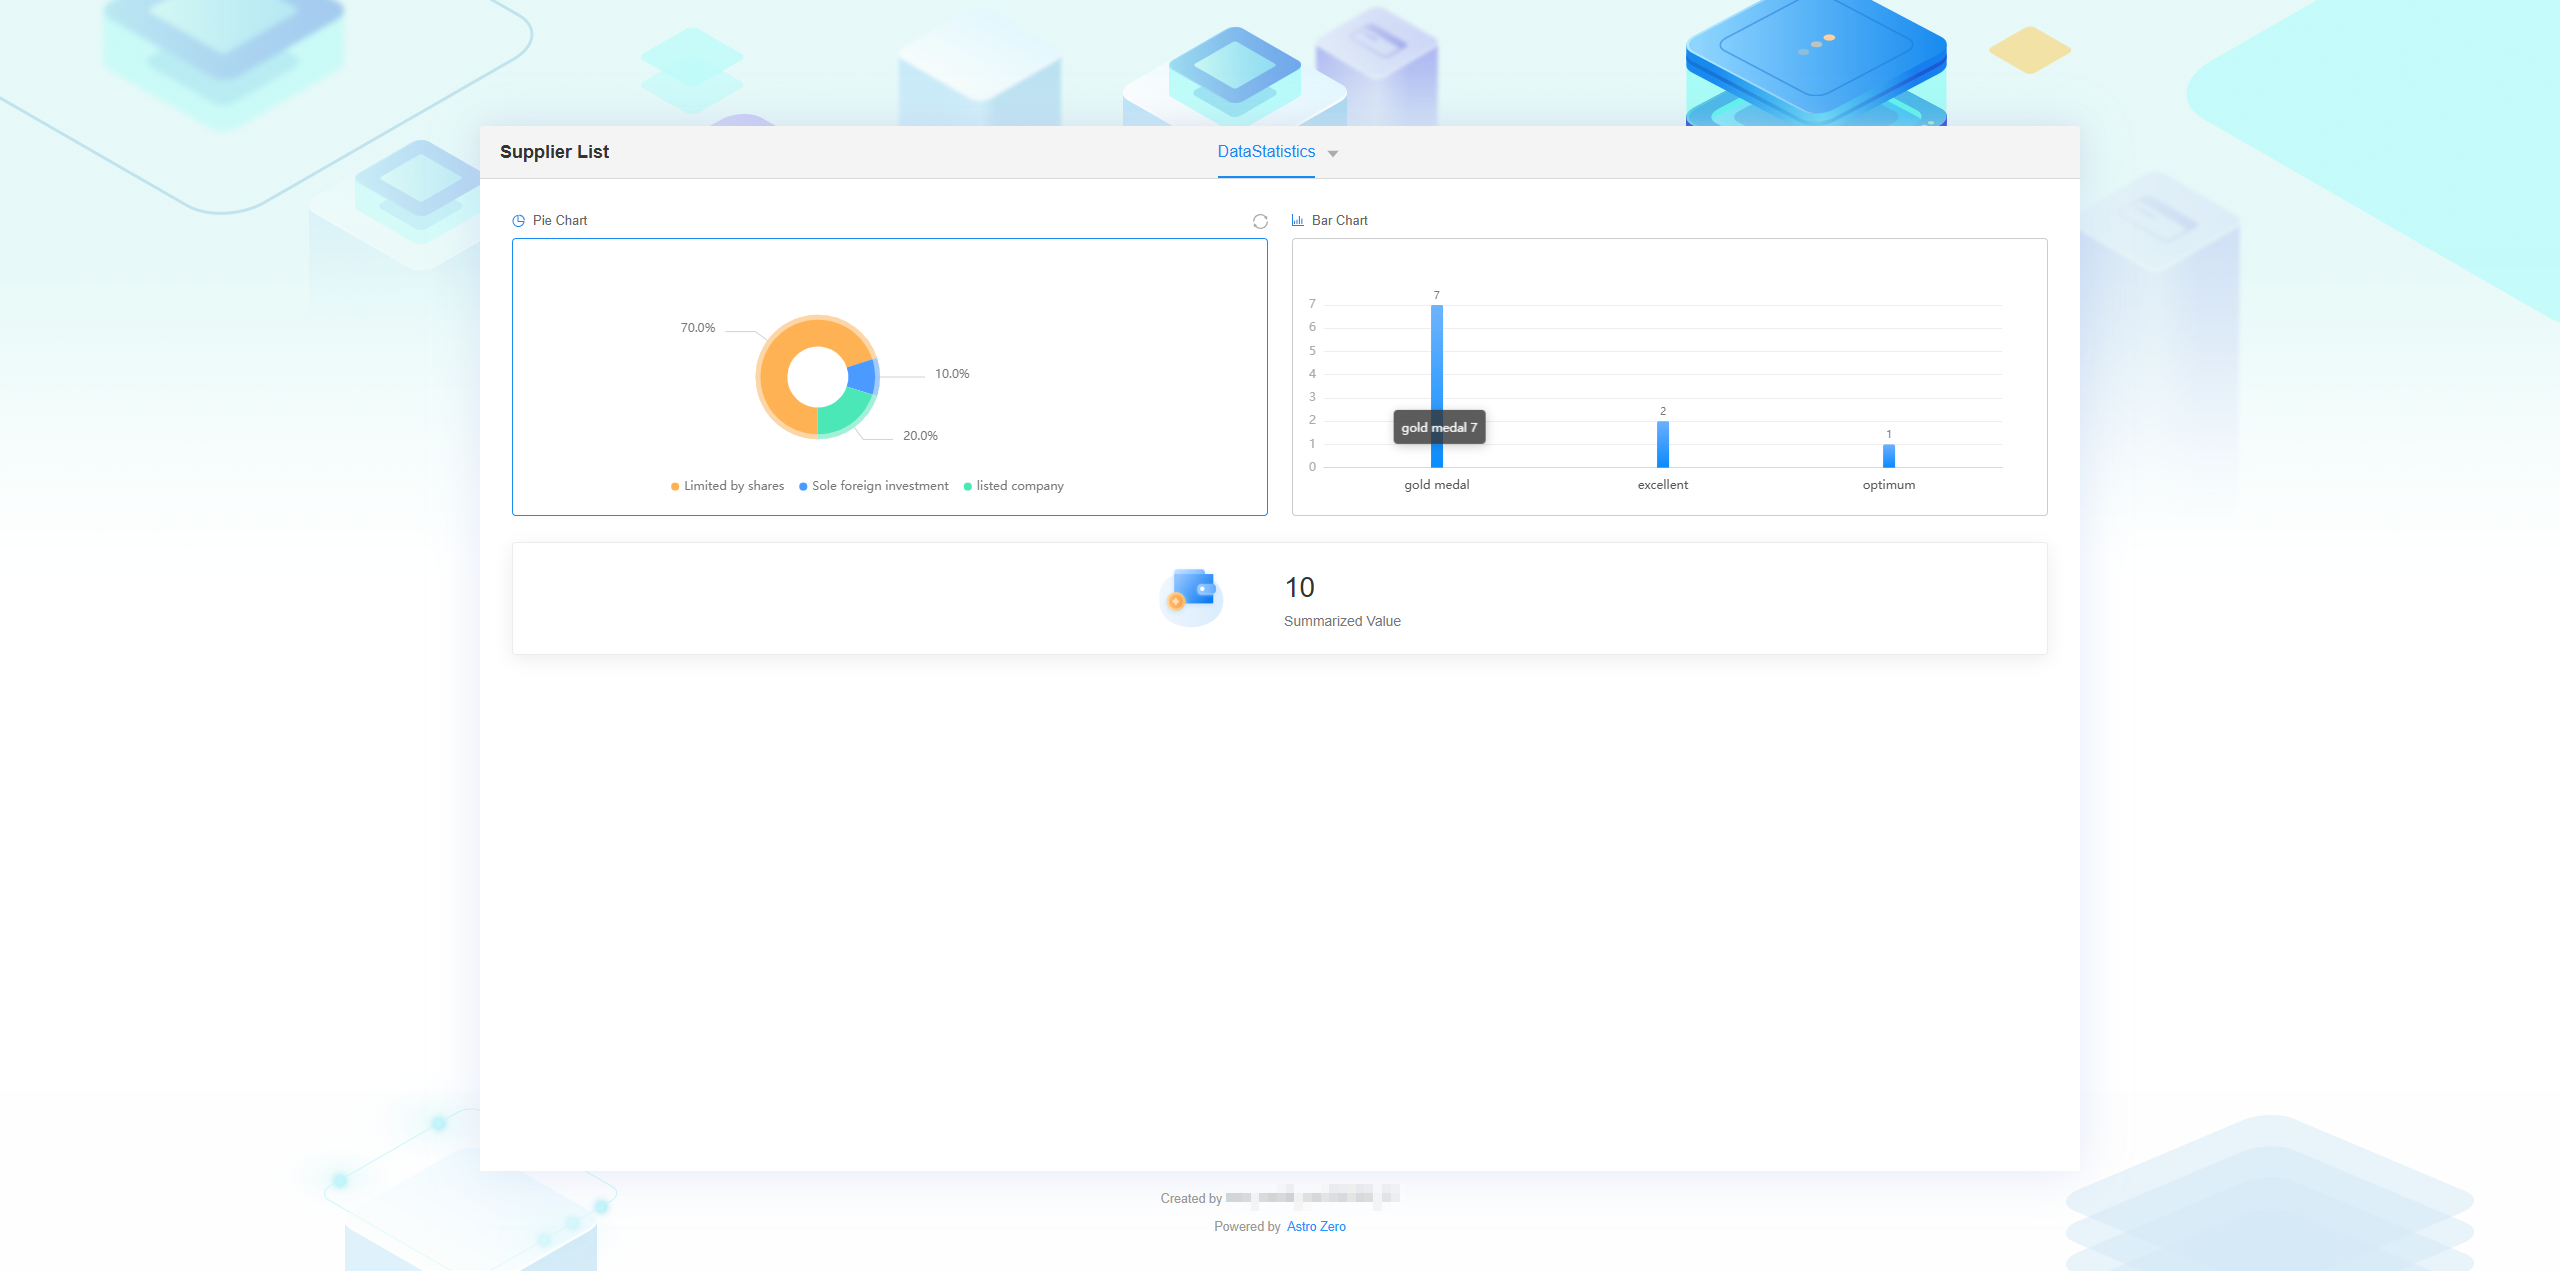
As shown in Figure 6, the Pie Chart, Bar Chart, and Summarized Value widgets are used, and widget properties are configured based on the data entered in the form.
When you hover the cursor over a widget, the icon for copying the widget is displayed. When the number of widgets on the page is greater than one, the icon for deleting the widget is also displayed.
Figure 7 Widget operation icons
- Click Save in the upper right corner of the page.
- In the upper left corner of the page, set the report name.
- Set the data range.
- On the right menu bar, choose Data Scope.
- Set the data source and data obtaining permission.
Figure 8 Setting the data range
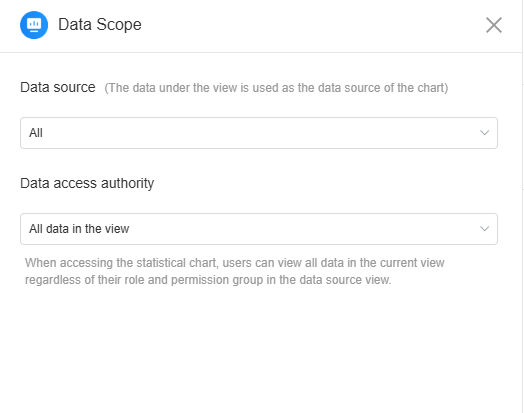
Table 1 Data range parameters Parameter
Description
Data source
Select data in a view as the data source of the data report.
Data access authority
Set the permission to obtain data.- Data permission of the inherited view: When a user accesses a statistical chart, the user can view only the data on which the user has permission based on the role permission group to which the user belongs in the data source view.
- All data in the view: When a user accesses a statistical chart, the user can view all data in the current view regardless of the role permission group to which the user belongs in the data source view.
- After the editing is complete, click Save in the upper left of the page to save the settings.
- Set the access permission for the data report.
- On the menu bar on the right, choose Permissions Settings.
- Set the permission to view the data report.
Figure 9 Setting permissions
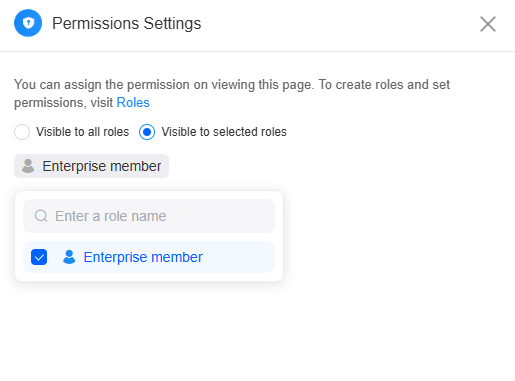
Table 2 Parameters for setting permissions Parameter
Description
Visible to all roles
All roles in the configuration center can check the view form, including preset roles and custom roles.
Visible to selected roles
Only specified roles can view the view form.
- After the editing is complete, click Save in the upper left of the page to save the settings.
- Check whether the data report meets the expectation.
- Click
 in the upper left corner of the page to return to the application development page.
 - Select the corresponding form and click Check Statistics to view the created data report.
Figure 10 Viewing the data report

- Click
 next to "Data Statistics" and choose Share Statistics to obtain the access link of the data report.
 - Copy the access link of the data report and send the link to a user whose role is enterprise member. The user can view the data report after opening the link.
Figure 11 Copying the access link of the data report
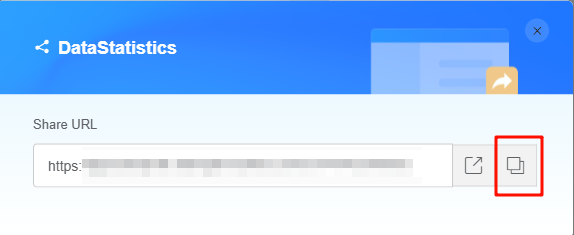 Figure 12 Data report displayed
- Click
Feedback
Was this page helpful?
Provide feedbackThank you very much for your feedback. We will continue working to improve the documentation.See the reply and handling status in My Cloud VOC.
For any further questions, feel free to contact us through the chatbot.
Chatbot


