
High CPU Usage of RDS for MySQL Instances
If the CPU usage of your RDS for MySQL instance is high or close to 100%, database performance deteriorates. For example, data read/write becomes slow, connecting to the instance takes a longer time, or errors are reported when you are trying to delete data.
Since November 25, 2021, 00:00 GMT+08:00, certain functions of Data Admin Service (DAS) have been available only to existing customers and no updates have been provided. The functions include SQL tuning, table structure comparison and synchronization, data tracking and rollback, test data generation, and DBA intelligent O&M in Development Tool, as well as storage analysis, intelligent parameter recommendation, historical transactions, and binlog parsing functions.
- For DB instances created after November 25, 2021, 00:00 GMT+08:00, Solution 1 is recommended.
- For DB instances created before November 25, 2021, 00:00 GMT+08:00, Solution 2 is recommended.
You are advised to enable SQL audit in advance so that you can view SQL execution records in audit logs to locate the fault when the CPU usage is high.
Solution 1
Analyze slow SQL logs and CPU usage to locate slow queries and then optimize them.
- View the slow SQL logs to check for slowly executed SQL queries and view their performance characteristics (if any) to locate the cause.
For details about how to query RDS for MySQL logs, see Viewing Slow Query Logs.
- View the CPU usage metric of your DB instance.
For details, see Viewing Performance Metrics.
- Create read replicas to reduce read pressure on the primary DB instance.
- Add indexes for associated fields in multi-table association queries.
- Do not use the SELECT statement to scan all tables. You can specify fields or add the WHERE condition.
Solution 2
You can identify slow query statements and optimize them according to the suggestions provided by DAS to reduce the CPU usage.
- Connect to the RDS for MySQL DB instance.
You can connect to an instance through a private or public network. For details, see the Relational Database Service Getting Started.
- Run the following command to show the running threads and locate the queries that are slowly executed:
show full processlist
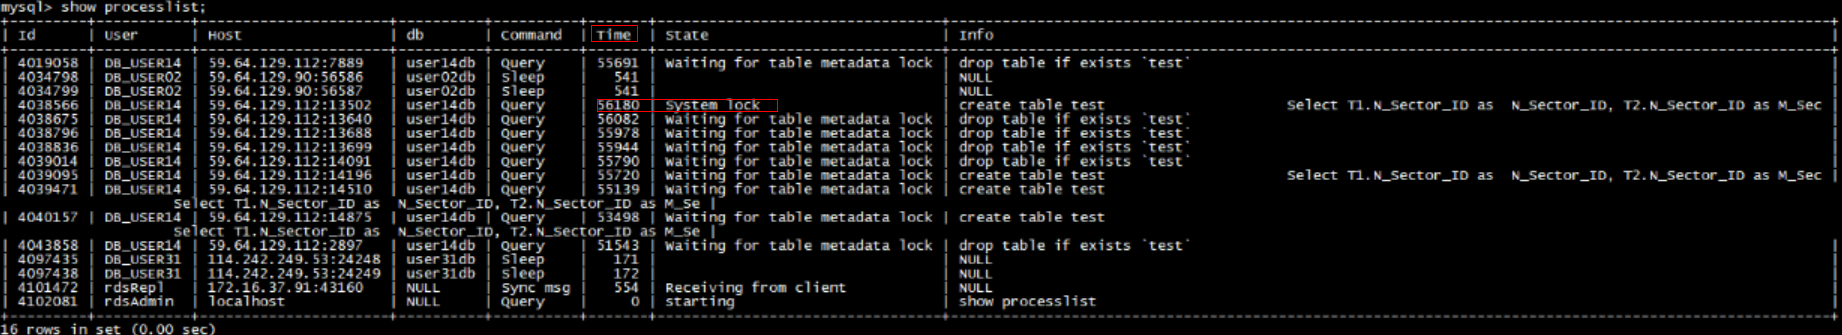
Check the values in the Time and State columns. As shown in the preceding figure, the long-running transaction ID is 4038566.
- Use SQL diagnosis of DAS to identify SQL statements that are executed frequently, consume a large amount of resources, or take a long time to execute. You can optimize the statements according to the diagnosis suggestions to ensure the stability of the database performance.
- Log in to the DAS console.
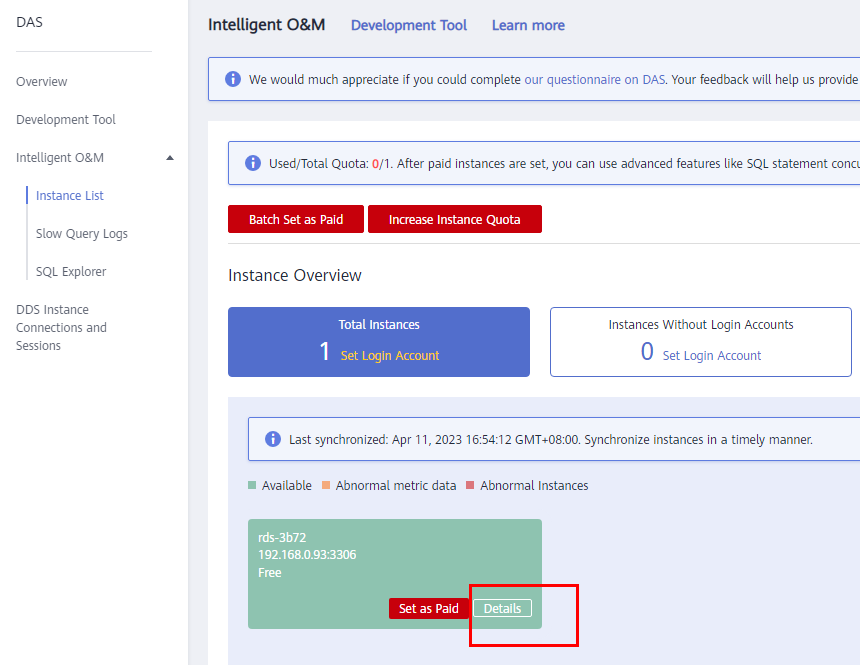
- In the navigation pane, choose Intelligent O&M > Instance List.
- Click Details on the instance.
Figure 1 Instance list
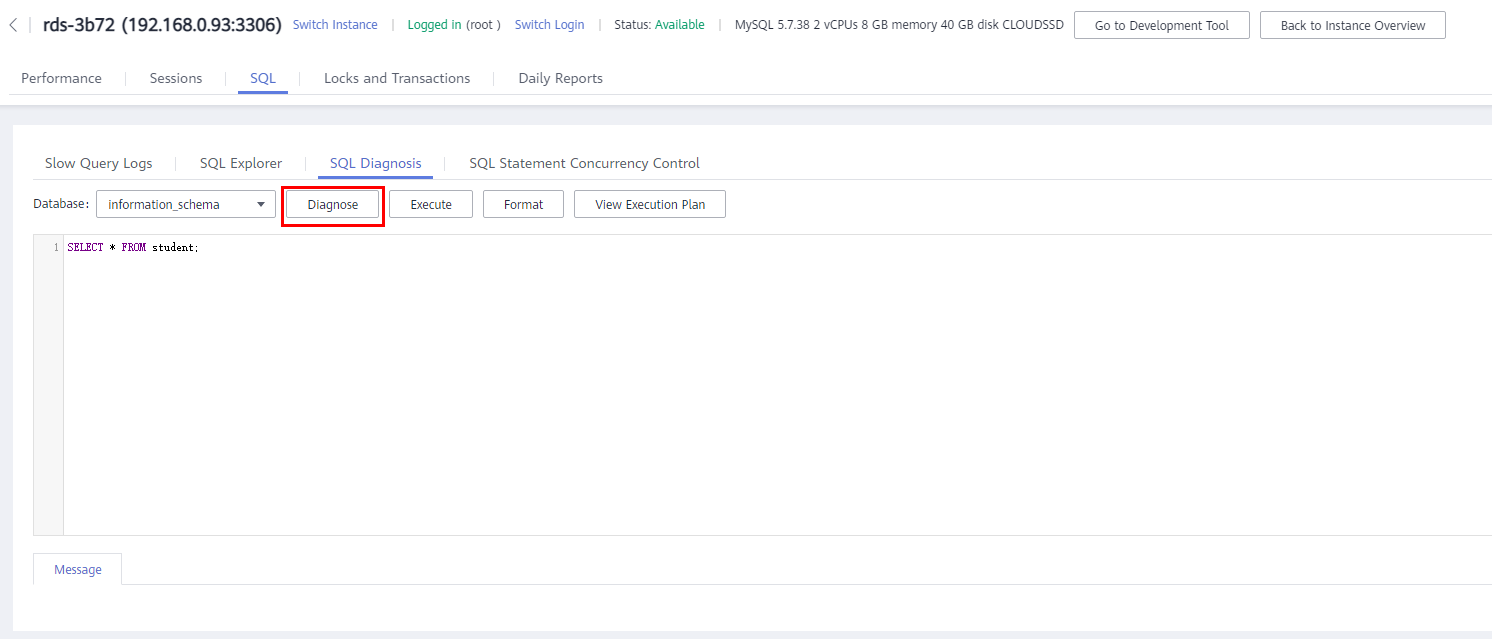
- Choose SQL > SQL Diagnosis.
- Select a database, enter an SQL statement, and click Diagnose.
Figure 2 SQL diagnosis
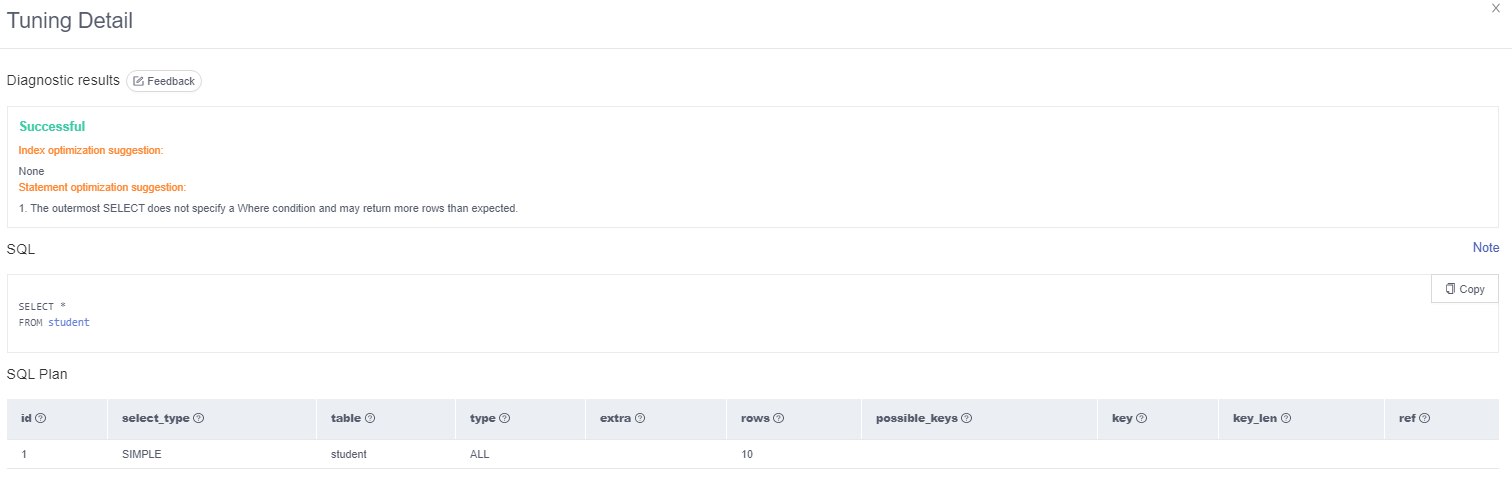
- View diagnosis details and obtain statement optimization suggestions.
Figure 3 Tuning details
- Only SELECT, INSERT, UPDATE, and DELETE statements can be diagnosed, and INSERT statements must contain SELECT clauses.
- SQL statements that use views cannot be diagnosed.
- SQL diagnosis obtains table structure and data distribution information (not raw data). The information is only used for logic diagnosis and is not stored on the DAS server.
- Obtaining table structure and data distribution information may cause additional load on the DB instance, but has little impact on its performance.
- SQL diagnosis history is the only data stored on the DAS server. If you delete the data, it will be permanently deleted from the server.
Feedback
Was this page helpful?
Provide feedbackThank you very much for your feedback. We will continue working to improve the documentation.See the reply and handling status in My Cloud VOC.
For any further questions, feel free to contact us through the chatbot.
Chatbot


