Tracking the Progress with Statistical Charts
You can use statistical charts to track the progress of work items in a project. Charts include the statistics of archived work items.
There are two types of charts available: custom and preset. The preset templates include the overview, workloads, work item distribution, sprints, and bug types. Select a template as required.
Constraints
The chart title is generated using the current system language and does not change with the language.
Prerequisites
- You have created a Scrum project. For details, see Creating a CodeArts Project.
- An IAM user has been added to the project. For details about how to add members, see Adding Members to a CodeArts Project.
- You have permissions to create charts, and create, rename, and delete chart types. For details about how to set permissions, see Managing Project Permissions.
Creating a Custom Chart
You can use custom charts to analyze the measures from several dimensions, including the Story point, Expected person-hours, Actual person-hours, and Work item.
- Access the CodeArts Req homepage.
- Access a Scrum project. Choose . Click Create Report. In the displayed dialog box, choose Custom Chart.
- On the page for creating a custom chart, configure the following information.
Figure 1 Creating a custom chart

Table 1 Parameters for creating a custom chart Parameter
Description
Title
Chart title. The value can contain 3 to 128 characters, including letters, digits, underscores (_), and hyphens (-).
Chart Type
Chart display type. The options include Bar or Pie.
Analysis Dimension
Data analysis dimension of a chart, that is, data dimension represented by the X axis.
Comparison Dimension
Data comparison dimension of a chart, that is, data dimension represented by the color block on the Y axis.
Measure
Data summary item of a chart, that is, data dimension represented by the Y axis. Statistics on the number of story points and work items, and estimated and actual workloads are supported.
Data Filtering
After clicking Add Filter, select a system field or create one to filter chart statistic data.
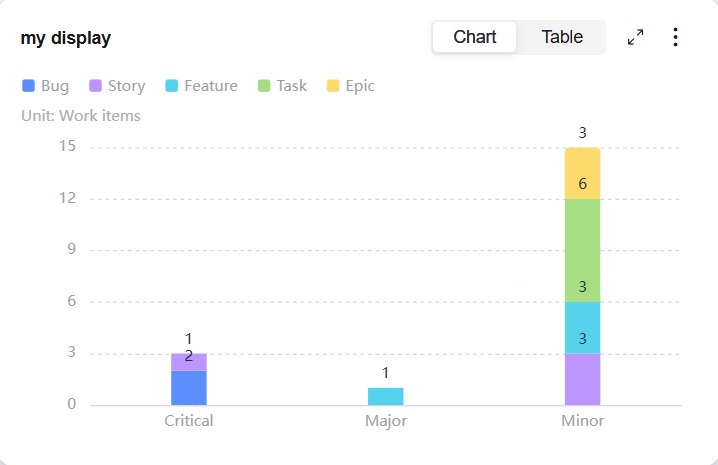
- Click Save. Saved charts are displayed on the Statistics homepage for you to easily view and modify.
Figure 2 Custom chart

Using a Preset Chart Template
Select a proper preset chart template based on the service scenario.
- You can use the Work Item Trend, Work Item Due Date Statuses, and Work Item Completion system charts to analyze work items.
- You can use the Person-Hours of Project Members system chart to analyze the person-hours of the project members.
- You can use the Work Items by Handler, Work Items by Priority, and Work Items by Historical Status system charts to analyze the work item distribution.
- You can use the Sprint Burndown Chart system chart to analyze the sprints.
- You can use the Bugs by Handler, Bugs by Creator, Bugs by Priority, Bugs by Work Item Status, and Bugs by Handler and Work Item Status system charts to analyze the work item bugs.
The following describes how to use the preset chart template Work Item Trend to create a chart.
- Access the CodeArts Req homepage.
- Access a Scrum project. Choose . Click Create Report. In the displayed dialog box, choose Work Item Trend.
- Go to the chart editing page and configure the following information.
Figure 3 Editing the work item trend overview

Table 2 Creating a chart on work item trend overview Parameter
Description
Title
Chart title. The value can contain 3 to 128 characters, including letters, digits, underscores (_), and hyphens (-).
Type
Collect statistics of tasks, bugs, epics, features, or stories. All means collecting statistics of all work item types in the project.
Data Filtering
You can select Sprint or Time Range to filter the data range to be displayed in a chart. If Time Range is selected, the maximum time duration is one year.
- Click Save. Saved charts are displayed on the Statistics homepage for you to easily view and modify.
Follow-up Operations
After operations in Creating a Custom Chart or Using a Preset Chart Template are complete, users who have permissions to Edit, Delete, Move, and Export charts can perform the operations listed in the table below.
|
Operation |
Description |
|---|---|
|
Switch chart display mode |
Click |
|
View chart in full screen |
Click |
|
Save chart |
Click |
|
Export chart |
Click |
|
Edit chart |
Click |
|
Move chart |
Click |
|
Delete chart |
Click |
You can manage created charts by category. Multiple chart cards are displayed in one view. By default, Non-Categorized charts are displayed. You can create chart categories as required. Each chart category can contain a maximum of 20 chart cards.
Managing Charts by Category
- Access a Scrum project. Choose and click
 in the Non-Categorized drop-down list. Enter a name in the Create Chart Category dialog box.
 - Click OK.
- Chart cards can be placed under chart categories.
- To rename a chart category, click
 on the right of the chart category name and choose Rename.
 - To delete a chart category, click
 on the right of the chart category name and choose Delete. After a chart category is deleted, charts under the category are automatically moved to Non-Categorized.
 - Within a chart category, you can drag the target chart to adjust its display sequence.
Feedback
Was this page helpful?
Provide feedbackThank you very much for your feedback. We will continue working to improve the documentation.See the reply and handling status in My Cloud VOC.
For any further questions, feel free to contact us through the chatbot.
Chatbot


