Viewing Kafka Metrics
Notes and Constraints
On the Monitoring > Monitoring Details page of the Kafka console, you can select a maximum of 50 resources from the drop-down list at a time. If you need to view the monitoring data of more than 50 resources, do so in batches.
Prerequisite
At least one Kafka instance has been created. The instance has at least one available message.
Procedure
- Log in to the Kafka console.
- Click
 in the upper left corner to select the region where your instance is located.
 - View the instance metrics in either of the following ways:
Table 1 Viewing metrics Data Type
Check Method
All
- In the row containing the desired instance, click View Metric. On the Cloud Eye console, view the metrics. Metric data is reported to Cloud Eye every minute.
- Click a Kafka instance name to go to the instance details page. In the navigation pane, choose Monitoring > Monitoring Details. On the displayed page, view the monitoring data. The data is updated every minute.
Specific
- Click a Kafka instance name to go to the instance details page. In the navigation pane, choose Instance > Topics. Click
 next to the topic name to be viewed. In the dialog box displayed, view the monitoring data by topic. The data is updated every minute.
 - Click a Kafka instance name to go to the instance details page. In the navigation pane, choose Instance > Topics. Click the desired topic to go to the topic details page. On the monitoring page, view the monitoring data by topic. The data is updated every minute.
Specified by consumer group
Click a Kafka instance name to go to the instance details page. In the navigation pane, choose Instance > Consumer Groups. Click the desired consumer group to go to the consumer group details page. On the monitoring page, view the monitoring data by consumer group. The data is updated every minute.
Click the following dimensions to view monitoring data:
- Single-node instance: By Instance, By Broker, By Topic, or By Consumer Group.
- Cluster instance: By Instance, By Broker, By Topic, By Consumer Group, or By Smart Connect.
Viewing Top Kafka KPI Data
- Log in to the Kafka console.
- Click
 in the upper left corner to select the region where your instance is located.
 - Click a Kafka instance name to go to the instance details page.
- Choose Monitoring > Overview in the navigation pane.
- In the KPI Rankings area, check the top 5, top 10, and top 20 data by consumer group, topic, and broker.
Table 2 KPI list Dimension
Key Metric
By Consumer Group
- Accumulated Messages
- Consumer Retrieved Messages
By Topic
- Total Messages
- Message Creation
- Message Retrieval
Broker
- CPU Usage
- Network Bandwidth Usage
- Disk Read Speed
- Disk Write Speed
Figure 1 KPI ranking
Checking the Monitoring View of Kafka Production Inbound Traffic
This function is unavailable for some existing instances. Contact customer service.
- Log in to the Kafka console.
- Click
 in the upper left corner to select the region where your instance is located.
 - Click a Kafka instance name to go to the instance details page.
- In the navigation pane, choose Monitoring > Overview.
- On KPI Rankings > By Dimension tab page, check the production inbound traffic.
Table 3 Production inbound traffic Dimension
Description
By topic
Topics are sorted by production inbound traffic in descending order, and the traffic is displayed by broker in different colors. Hovering your mouse over a topic bar displays the production inbound traffic of the broker.
Select one or more brokers from the drop-down box in the upper right corner to view the broker production inbound traffic.
A maximum of top 20 topics can be displayed.
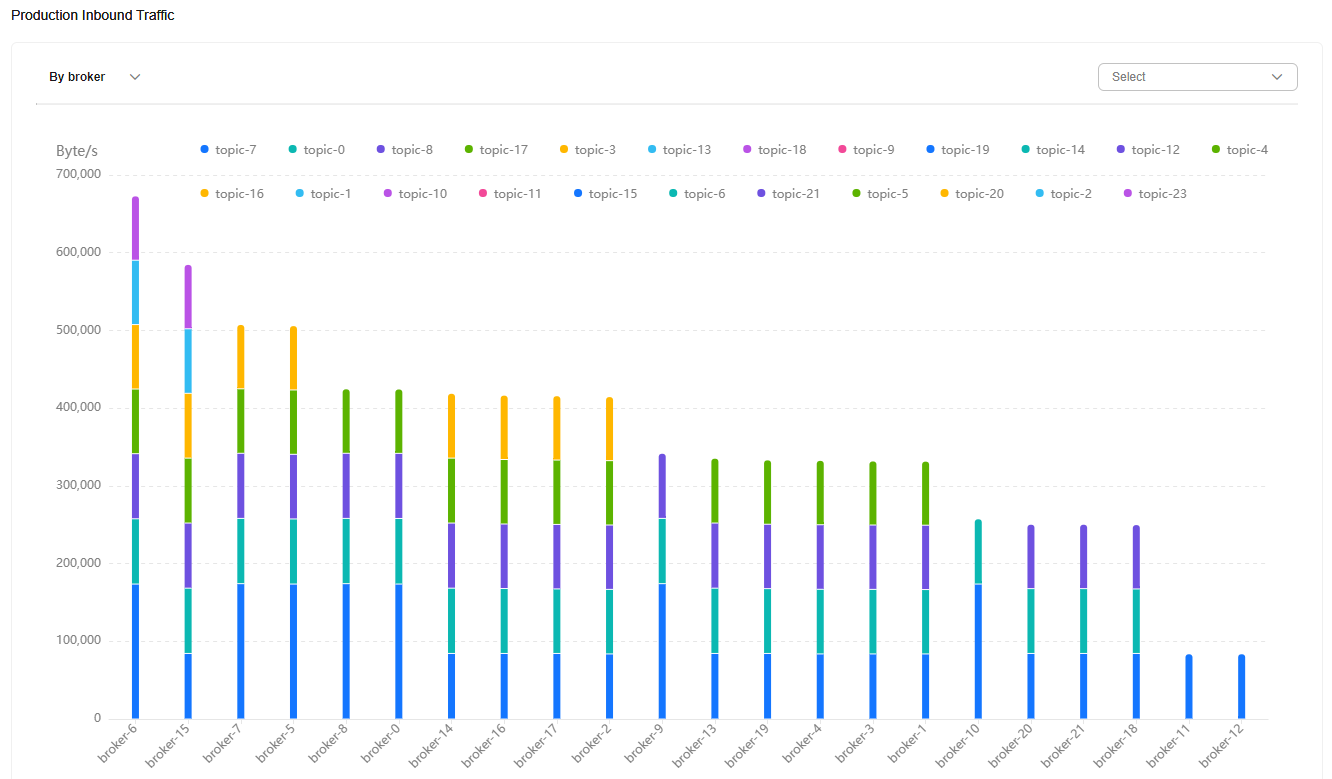
By broker
Brokers are sorted by production inbound traffic in descending order, and the traffic is displayed by topic in different colors. Hovering your mouse over a broker bar displays the production inbound traffic of all topics.
Select one or more topics from the drop-down box in the upper right corner to view the topic production inbound traffic.
Figure 2 Production inbound traffic by broker
Related Document
Feedback
Was this page helpful?
Provide feedbackThank you very much for your feedback. We will continue working to improve the documentation.See the reply and handling status in My Cloud VOC.
For any further questions, feel free to contact us through the chatbot.
Chatbot


