Data Storage Insights
Scenarios
GaussDB lets you monitor key storage metrics for your instance components, including used data disk space, disk usage rate, Xlog size, and detailed storage information for database tables.
Constraints
The DB engine version of GaussDB instances must be V2.0-3.208.0 or later.
Precautions
- Only one database can be selected at a time in the All Databases area to view table statistics.
- Statistics on tables of system users are not collected.
- Only schemas that contain at least one table are included in the collection.
- When you change the deployment model of an instance or add shards, data migration and redistribution will occur. Use this feature after those operations are fully completed.
- The value provided in the Available days of storage field is an estimate. Actual available days may vary due to workload changes.
Viewing the Instance Storage Overview
- Log in to the management console.
- Click
 in the upper left corner and select a region and project.
 - Click
 in the upper left corner of the page and choose .
 - On the Instances page, click the name of the target instance to go to the Basic Information page.
- Choose .
- In the Disk Usage area, review the data disk usage of the instance.
Table 1 Metric description Metric
Description
Used/Total
This metric displays the amount of data disk space currently used and the total available capacity for the nodes of the monitored object.
Average daily growth
This value indicates the average daily increase in stored data over the past 7 days.
Available days of storage
The value provided here is an estimate. Actual available days may vary due to workload changes. Available days of storage = (Total instance storage – Used capacity)/Average daily growth
- Select the instance components, nodes, and time range to view the metric data of the corresponding components and nodes.
Figure 1 Trends

Table 2 Metric description Metric
Description
Used Data Disk Space
Real-time used data disk size of the selected nodes
Data Disk Usage
Real-time data disk usage of the selected nodes
Xlog Size
Real-time size of Xlogs in the data directory on a CN or DN
Viewing Database Table Data
- Log in to the management console.
- Click
 in the upper left corner and select a region and project.
 - Click
 in the upper left corner of the page and choose .
 - On the Instances page, click the name of the target instance to go to the Basic Information page.
- Choose .
- Scroll down to the Table Storage Details area. On the All Databases tab, click
 next to the target database to expand its schemas. Then, select one or more schemas to view corresponding table statistics on the right.
Figure 2 Database table information
You can also click Top 20 Tables to view statistics of the 20 largest tables among all databases.
Table 3 Field description Field
Description
Table Name
Table name.
Table Owner
Owner of the table.
Schema
Name of the schema the table belongs to.
Database
Name of the database the table belongs to.
Partitioned Table
Whether the table or index has the property of a partitioned table.
Hash Partitioned
Whether the table contains a hash-partitioned column.
Rows
Number of rows in the table.
Created
Creation time.
Last DDL Time
Last time when a DDL operation is performed.
Total Size
Table size.
Avg. Size per DN
The ideal evenly-distributed size of a table on each DN. Avg. Size per DN = Total table size/Number of DNs This field is only available for distributed instances.
Max DN Size
Ratio of the maximum table size on a single DN to the total table size. Max DN Size = Maximum size occupied by a table on a single DN/Total table size This field is only available for distributed instances.
Min DN Size
Ratio of the minimum table size on a single DN to the total table size. Min DN Size = Minimum size occupied by a table on a single DN/Total table size This field is only available for distributed instances.
Total Data Skew
Table skew. Total Data Skew = Maximum size occupied by a table on a single DN – Minimum size occupied by a table on a single DN This field is only available for distributed instances.
Data Skew Rate
Table skew rate. Data Skew Rate = Total data skew/Total table size This field is only available for distributed instances.
Data Distribution Standard Deviation
Standard deviation of table distribution. (For two tables of the same size, a larger deviation indicates a more severe skew.) This field is only available for distributed instances.
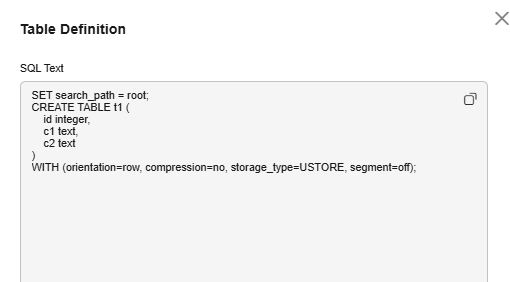
- Click Table Definition in the Operation column to view the table definition.
Figure 3 Table definition

Feedback
Was this page helpful?
Provide feedbackThank you very much for your feedback. We will continue working to improve the documentation.See the reply and handling status in My Cloud VOC.
For any further questions, feel free to contact us through the chatbot.
Chatbot


