
Dashboard
The Overview page of Edge Security on the console displays your resource protection overview, security trend, protection event trend, top 5 event sources, DDoS trend, purchased product information, protection policies, and attack request distribution in real time, helping you understand protection overview and security risks.
Viewing the Dashboard
- Log in to the EdgeSec console.
- In the navigation pane on the left, choose Dashboard under Edge Security. The Dashboard page is displayed.
- View the dashboard. For details, see Table 1.
Figure 1 Dashboard
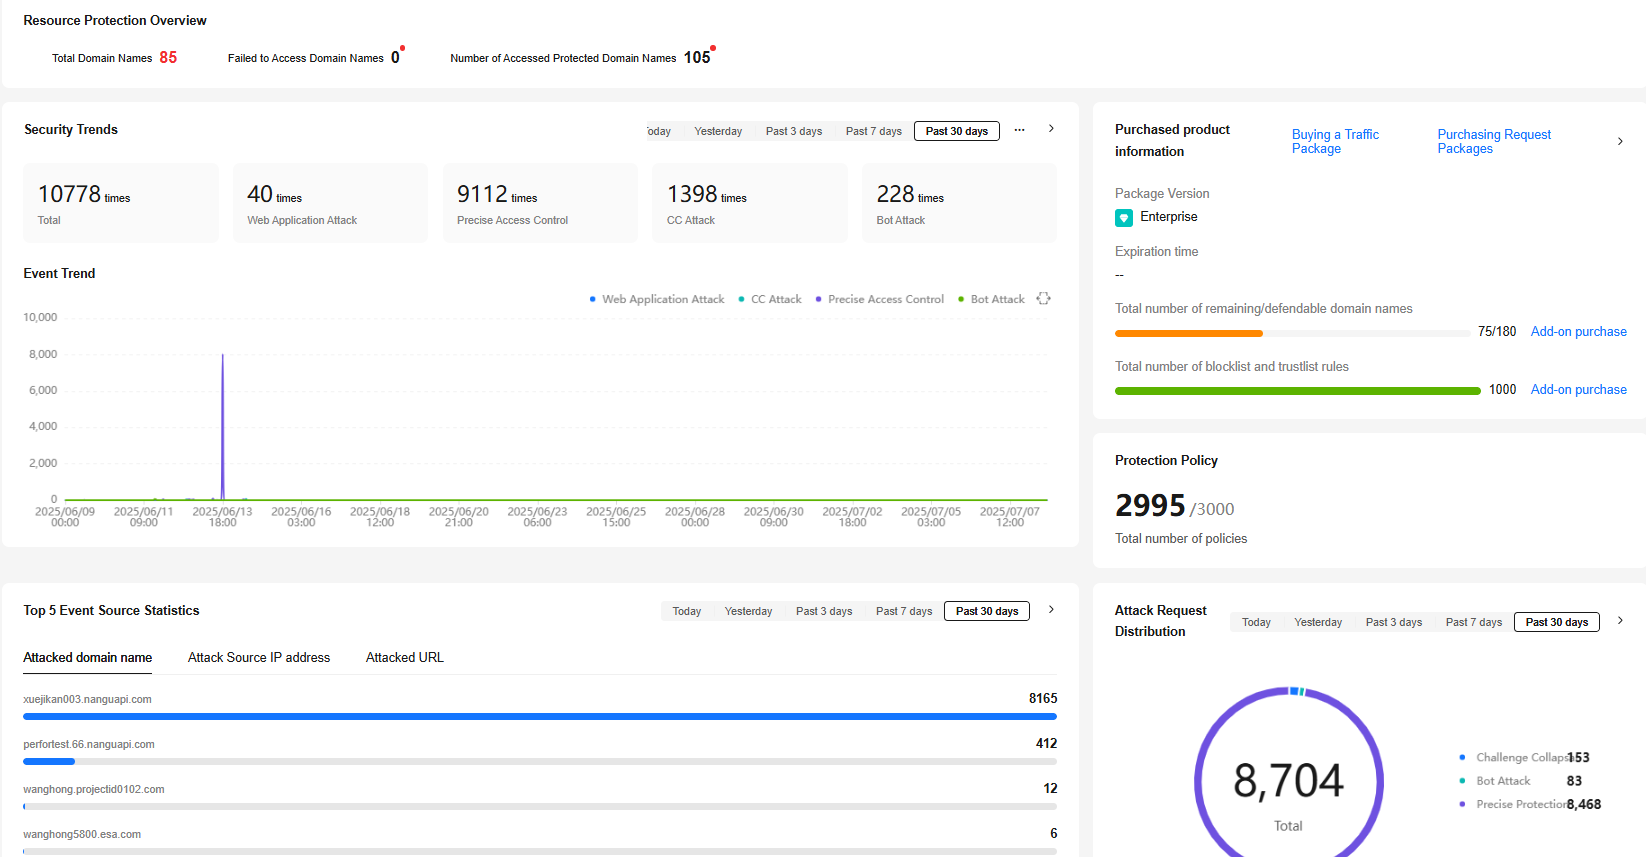
Table 1 Dashboard components Component
Description
Resource Protection Overview
Displays the total number of domain names, number of domain names that fail to be accessed, and number of domain names that have been accessed.
Click the number of domain names that have been accessed. The Domain Name Access page is displayed.
Purchased product information
Displays information about purchased products, including the edition, total number of protected domain names, and total number of blacklist and whitelist rules.
Click Add-on purchase to go to the page for purchasing an extension package.
Protection Policy
Displays the total number of protection policies.
Security Trends and Event Trend
For details, see Web Security Overview.
Top 5 Event Source Statistics and Attack Request Distribution
For details, see Web Security Overview.
DDoS Trends
For details, see DDoS Security Overview.
Feedback
Was this page helpful?
Provide feedbackThank you very much for your feedback. We will continue working to improve the documentation.See the reply and handling status in My Cloud VOC.
For any further questions, feel free to contact us through the chatbot.
Chatbot


