
SQL Insights
SQL Insights allows you to not only query all executed SQL statements, but also analyze and search for the tables that are accessed and updated most frequently, and the SQL statements with the longest lock wait, helping you quickly identify exceptions.
Usage Notes
- You need to enable Collect All Query Logs before using SQL Insights. Collecting all SQL statements may cause less than 5% performance loss.
- After Collect All Query Logs is disabled, new SQL statements will not be collected and the collected SQL data will be deleted.
- All SQL statements are constrained by the memory buffer. When service volume is high, buffer overflow may result in dropped records.
- Any SQL statement that exceeds the upper limit will be discarded by default.
You can set rds_sql_tracer_max_record_size to specify the upper limit. For details, see Modifying Parameters of a TaurusDB Instance.
Procedure
- Log in to the console.
- Click
 in the upper left corner and select a region and project.
 - Click
 in the upper left corner, and under Databases, click Data Admin Service.
 - In the navigation pane, choose Intelligent O&M > Instance List.
Alternatively, on the Overview page, click Go to Intelligent O&M.
- In the upper right corner of the Instance List page, search for instances by engine type, instance name, or instance IP.
- Locate the target instance and click Details. The Dashboard page is displayed.
- Choose SQL > SQL Insights.
If Collect All Query Logs is disabled, DAS cannot collect all SQL statements for analysis. You can click Log Settings and enable Collect All Query Logs.
Figure 1 Log Settings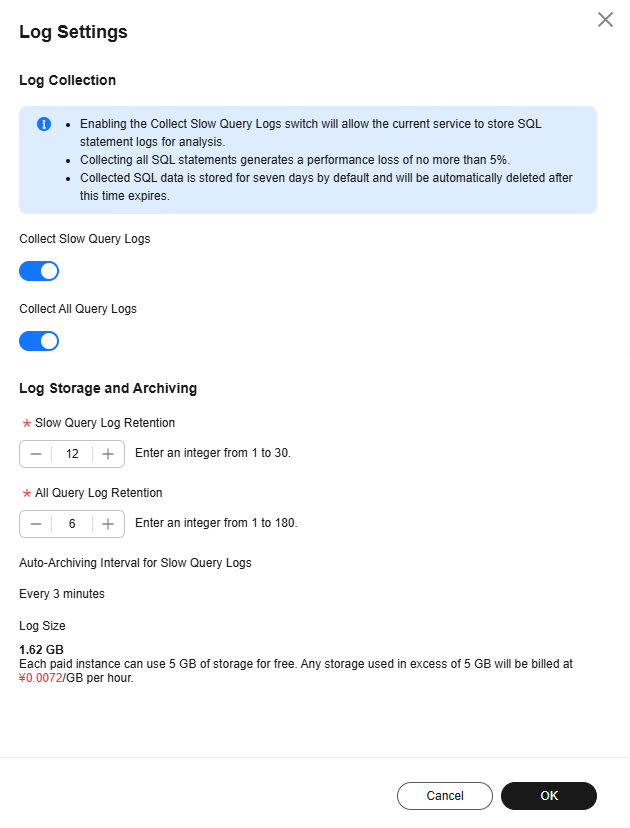

Collect All Query Logs takes effect once it is enabled.
To disable Collect All Query Logs, click Log Settings and toggle off the switch.
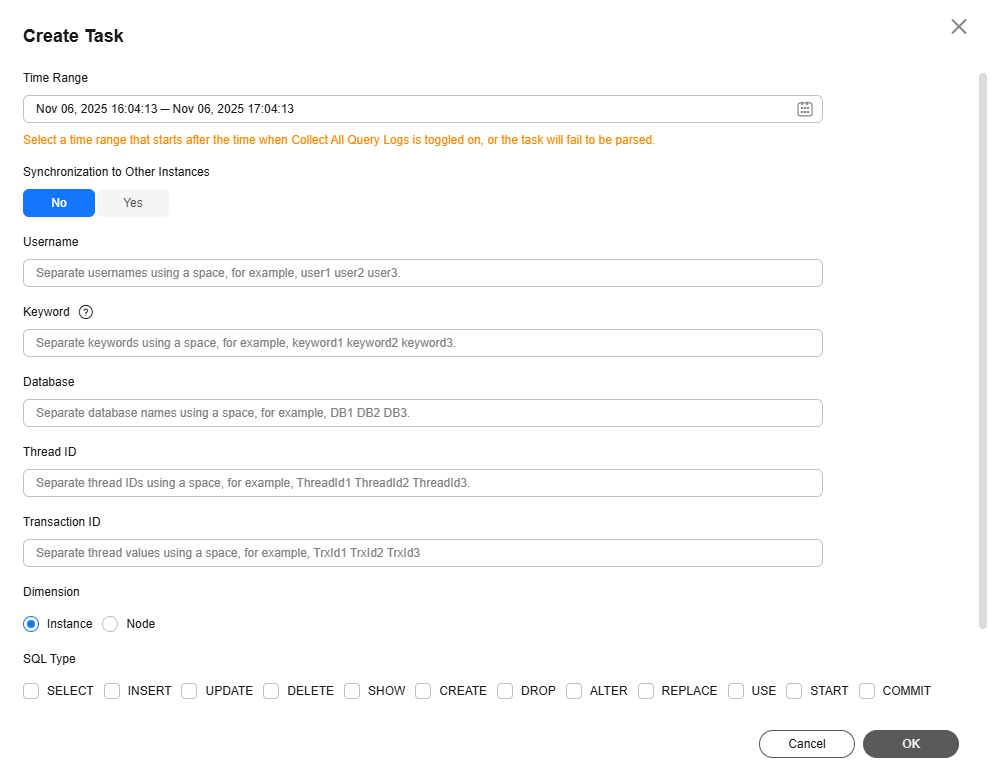
- Click Create Task. In the displayed dialog box, specify Time Range, Dimension, and other configuration items and click OK.
Figure 2 Creating a task
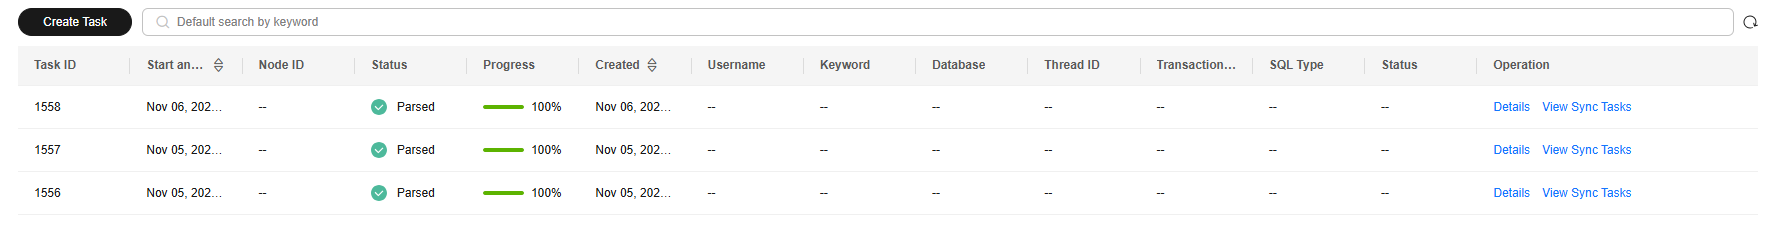
- In the task list, view the SQL Insights task.
Figure 3 Viewing a task
- Locate the target task and click Details in the Operation column to view and export details about the SQL Insights task.
- Set SQL Type, Node, and Advanced Search. Click
 to export the task details.
Figure 4 Task details
to export the task details.
Figure 4 Task details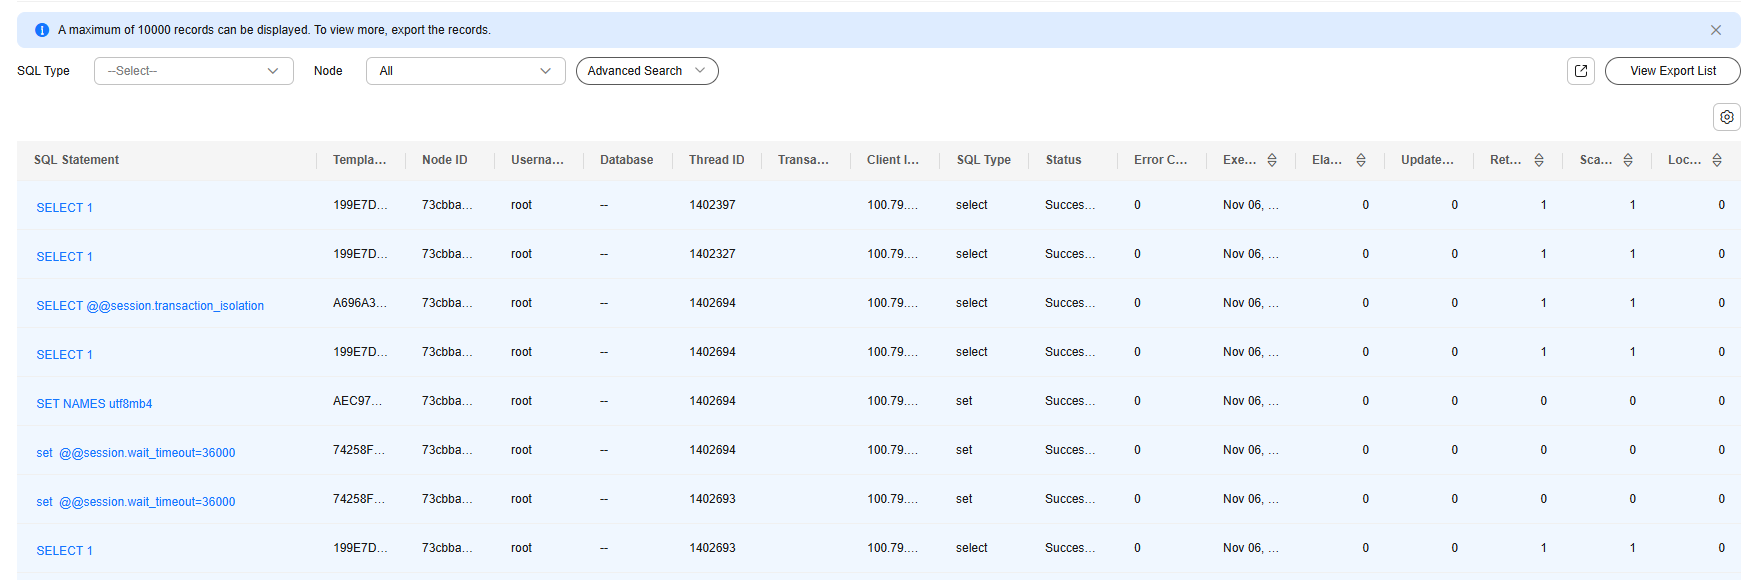
A maximum of 10,000 records can be displayed. To view more, export the records.
- Click View Export List.
Figure 5 View Export List
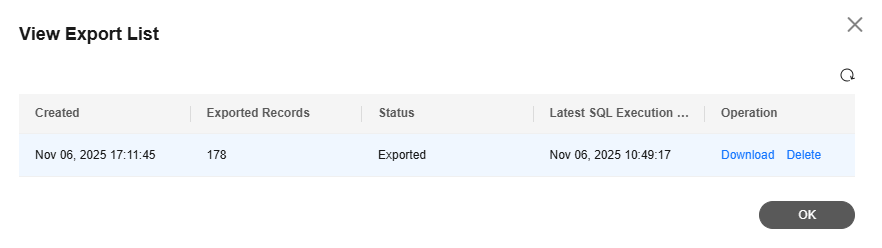
- Click Download to download all SQL details.
- Set SQL Type, Node, and Advanced Search. Click
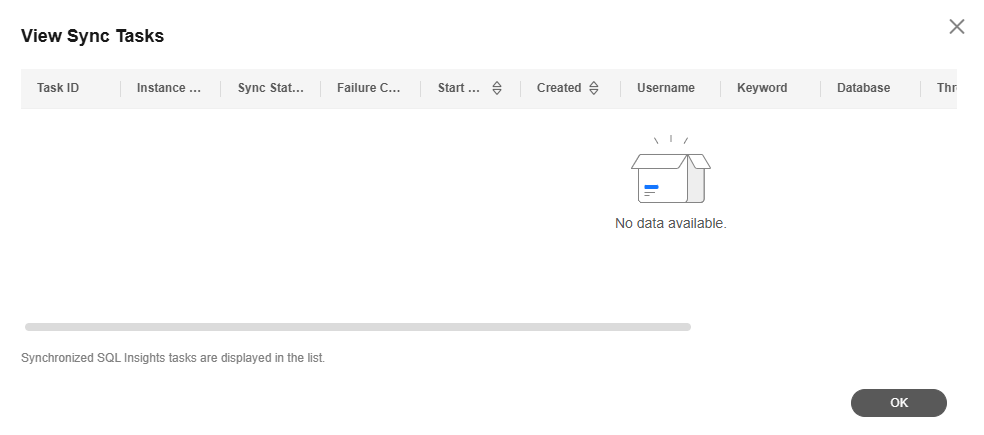
- Locate your task and click View Syn Tasks in the Operation column to view synchronization task details.
Figure 6 SQL Insights task synchronization list
- Locate the target task and click Details in the Operation column to view and export details about the SQL Insights task.
Feedback
Was this page helpful?
Provide feedbackThank you very much for your feedback. We will continue working to improve the documentation.See the reply and handling status in My Cloud VOC.
For any further questions, feel free to contact us through the chatbot.
Chatbot


