Help Center/
Blockchain Service/
User Guide/
Enhanced Hyperledger Fabric BCS Management/
Instance Management/
O&M Center/
Viewing Monitoring Data and Logs
Updated on 2025-07-24 GMT+08:00
Viewing Monitoring Data and Logs
BCS provides O&M monitoring capabilities. Technical support engineers can view the monitoring data and logs on the BCS console.
Viewing Monitoring Data
- Log in to the BCS console.
- In the navigation pane, click Instance Management to view the basic information of a BCS instance, including the blockchain type, consensus mechanism, status, and creation time.
- On an instance card, click the instance name.
- Click the Monitoring tab to view the service monitoring and instance monitoring data.
- Service monitoring allows you to view the CPU usage, physical memory usage, network traffic, TPS, and disk usage of the service.
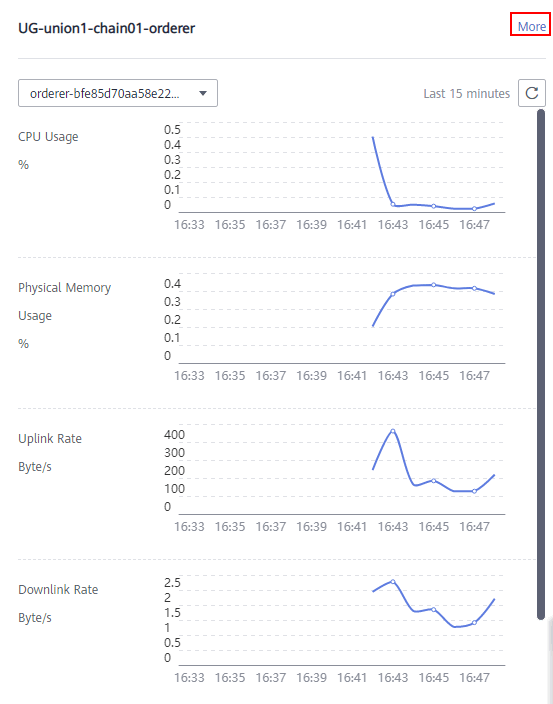
- Instance monitoring allows you to view the organization instance information, including the CPU usage, disk read rate, disk write rate, physical memory usage, uplink rate, and downlink rate.
You can click View Metrics to view the data of the last 15 minutes. You can also click More to view more monitoring data.
Figure 1 Viewing more monitoring data
Viewing Logs
- Log in to the BCS console.
- In the navigation pane, click Instance Management to view the basic information of a BCS instance, including the blockchain type, consensus mechanism, status, and creation time.
- On an instance card, click the instance name.
- Click the Logs tab. By default, log data in the last 5 minutes is displayed, including the log file name, creation time, and log content.
To view more logs or export logs, go to the AOM console.Figure 2 Viewing logs

Parent topic: O&M Center
Feedback
Was this page helpful?
Provide feedbackThank you very much for your feedback. We will continue working to improve the documentation.See the reply and handling status in My Cloud VOC.
The system is busy. Please try again later.
For any further questions, feel free to contact us through the chatbot.
Chatbot


