Debugging Advanced Pages
During the development of advanced pages, you may encounter issues with styling or functionality. To efficiently troubleshoot these issues, use the browser's built-in developer tools.
Common Methods for Debugging Frontend Pages
- Using DOM and CSS style
You can edit the page's layout and design by manipulating the DOM and CSS. With the developer tools open, use the arrow button in the top-left to select an element, then check and modify its DOM structure and CSS styles on the Elements tab. Changes are applied instantly, allowing you to see the effects in real time.
- Printing log information
On the Console tab page, you can use the console to print logs. You can debug JavaScript on the Sources tab by adding multiple console.log() statements into code. After reloading, check the Console tab for the output. The Sources tab is split into a file list on the left, selected file content in the center, and a debugging pane on the right. To log messages in JavaScript, locate the relevant file, find the code, and insert console.log() statements.
- Calling Astro Zero APIs
On the Console tab page, you can use the console to call the Astro Zero's APIs to obtain related information for debugging.
- Breakpoint debugging
On the Sources tab page, you can set breakpoints for debugging JavaScript, allowing DevTools to pause execution and display all variable values. You can choose from code line, conditional code line, DOM, and event listener breakpoints in Chrome's developer tools based on your needs. For details, see Table 1.
Table 1 Chrome breakpoint types and application scenarios Breakpoint Type
Scenario
Code line
In the exact code area.
Conditional code line
In the exact code area, and only when some other conditions are true.
DOM
In code that changes or removes a particular DOM node or its children.
XHR
When the XHR website contains a string pattern.
Event
In the code that runs after an event such as a click is triggered.
Listener
In the line of code that throws a caught or uncaught exception.
Abnormal function
A specific function is called at any time.
Code line breakpoint debugging is the most common method for code line breakpoint debugging. To set a code line breakpoint, find the request file by directory in the request file list on the left of Sources. You can also press Ctrl+F to search for related files. In the Sources intermediate file content area, locate the code line for which you want to set a breakpoint and click the line number. A blue icon is displayed, indicating that there is a code line breakpoint on the line. As shown in Figure 1, a code line breakpoint is set at line 49 in the global_BubbleChartWidget.js file.
Refresh the web page. The event running is paused before the code is executed. You can click
 in the debugging pane on the right to perform step-by-step debugging or click
  in the debugging pane to continue the event.
 - Multi-device testing
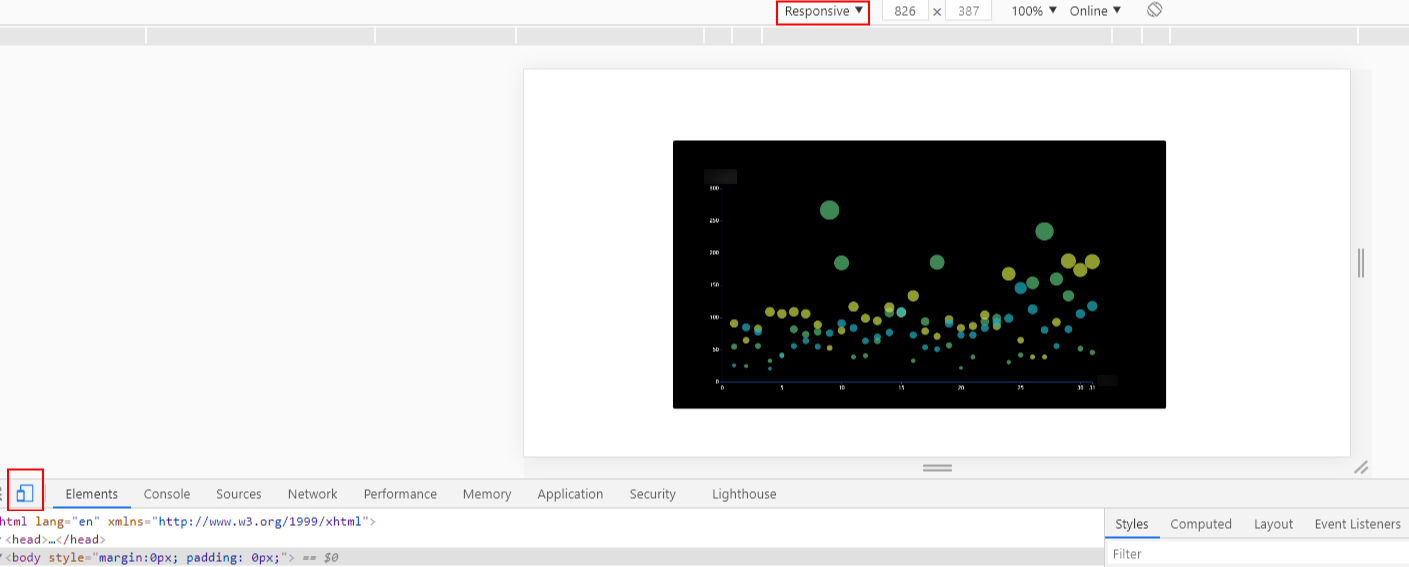
During the page adaptation test, you can use the mobile device simulation function provided by the Chrome developer tool. With this function, you can quickly test multiple terminals on a web page without any physical object.
Click
 to open the simulated mobile device interface. When the device toolbar is opened, it is in adaptive viewport mode by default. You can adjust the viewport size to any size you want. You can also select multiple terminal models.Figure 2 Simulating mobile devices
Feedback
Was this page helpful?
Provide feedbackThank you very much for your feedback. We will continue working to improve the documentation.See the reply and handling status in My Cloud VOC.
For any further questions, feel free to contact us through the chatbot.
Chatbot


