

Quickly Building Server Monitoring Capabilities
Scenarios
Server resources are the most important cloud resources. Monitoring and alarm reporting for server resources are critical to O&M. You can use Cloud Eye to quickly build server monitoring capabilities. By installing the Cloud Eye Agent on ECSs or BMSs, you can view monitoring data in a visualized manner and configure monitoring alarms for key service metrics or events. This helps you learn the real-time and accurate running status of server resources on the cloud. This section uses an ECS as an example to describe how to set alarm rules for CPU usage.
Procedure
| Procedure | Description |
|---|---|
| Purchase an ECS. Check that the ECS is displayed in the server monitoring list on Cloud Eye. | |
| Install the Cloud Eye Agent on the server. | |
| View key metric data. | |
| Set custom alarm rules for specific monitoring metrics. | |
| When an alarm condition is met, Cloud Eye calls SMN APIs to send notifications. You can also view the alarm information in alarm records. | |
| Create a masking rule to mask alarm notifications if needed. |
Preparations
Purchase an ECS. Check that the ECS is displayed in the server monitoring list on Cloud Eye.
Step 1: Install the Agent on the ECS
Basic, OS, and process metrics of ECSs can be reported. The ECS service reports basic metrics every 5 minutes. You can install the Cloud Eye Agent on ECSs to report OS metrics every minute. Once installed, Cloud Eye reports OS metrics every minute with greater accuracy and detail. For better monitoring, you are advised to install the Agent on your ECSs after you buy them.
The following describes how to install the Agent.
Agent installation methods for Windows and Linux OSs are different.
For a Windows ECS, you can only install the Agent manually. There are two methods for you to find the installation instructions.
- On the Server Monitoring page of the Cloud Eye console, click Install Manually to view the instructions. Then, log in to the ECS and run the installation command to install the Agent. Figure 1 Agent installation guide

- Alternatively, you can install the Agent by referring to the instructions provided in Installing the Agent on the official website.
You can install the Agent on one or more Linux ECSs at a time.
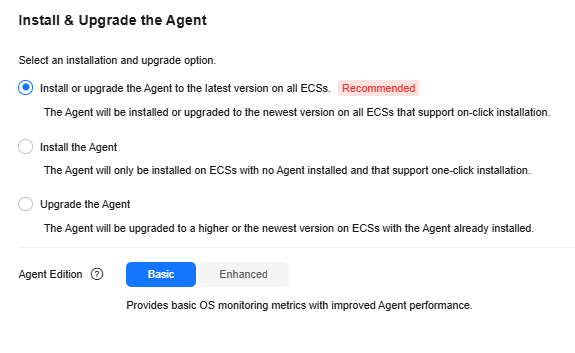
- For ECSs that support one-click installation, you can batch install the Agents for them on the console, which is more efficient. Figure 2 Installing and upgrading the Agent
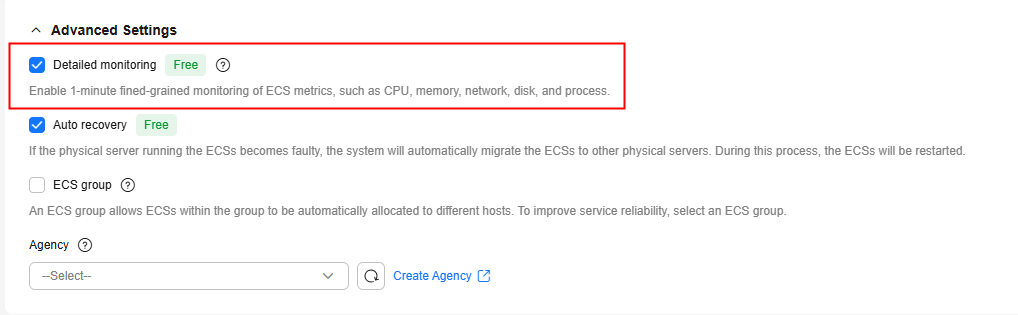
- For certain ECSs, you can enable Cloud Eye monitoring when you purchase them. The Agent will be installed automatically. For details, see Purchasing and Using a Linux ECS. Figure 3 Enabling detailed monitoring
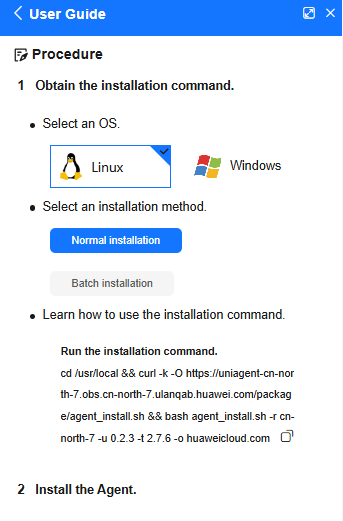
- For Linux ECSs that do not support one-click installation, you can manually install the Agents for them one by one or in batches. Click Install Manually above the server list to check the installation guide. Figure 4 Agent installation guide
After the Agent is installed, you can view it in the server monitoring list. If the Agent Status of an ECS is Running, the Agent is installed for the ECS.

Step 2: View ECS Monitoring Metrics
- Log in to the Cloud Eye console.
- In the navigation pane, choose Server Monitoring > Elastic Cloud Server.
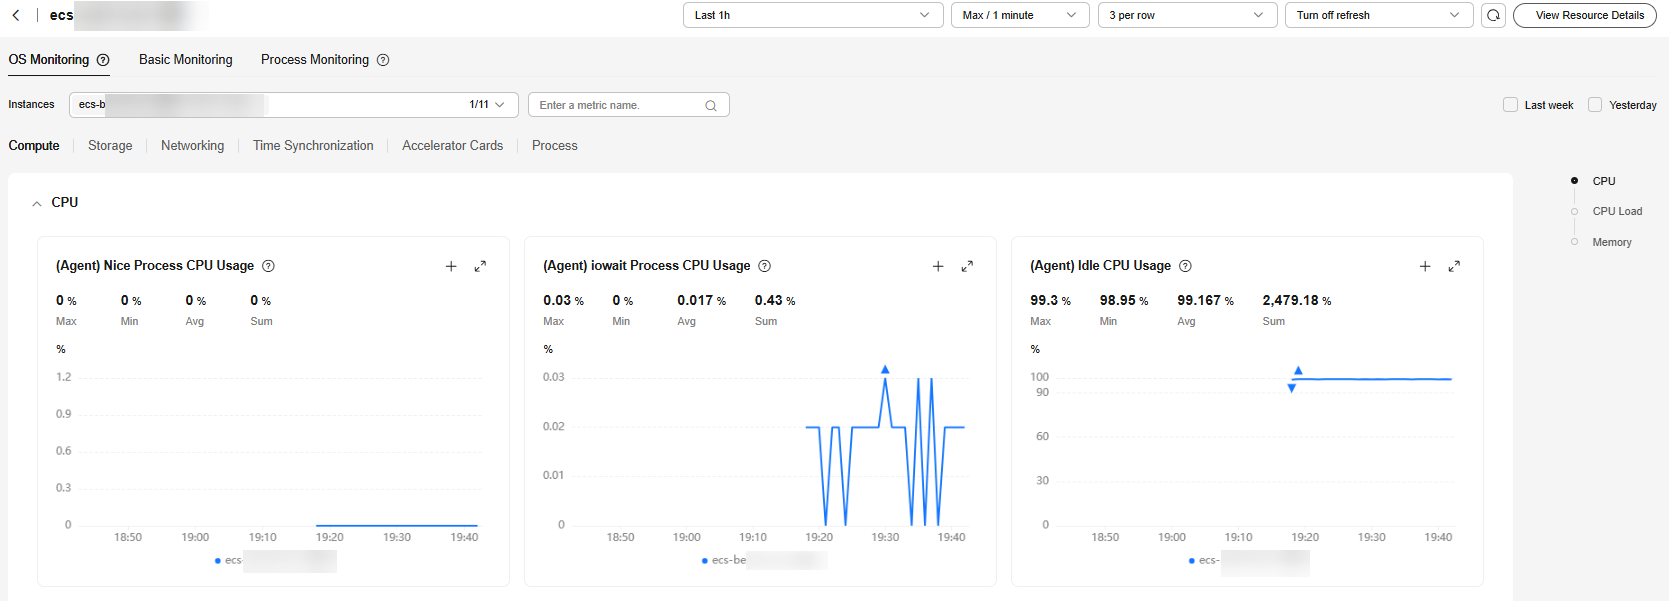
- Locate the target ECS and click View Metric in the Operation column to view the OS monitoring metrics, basic monitoring metrics, and process monitoring metrics. Figure 6 OS monitoring
Step 3: Create an Alarm Rule to Monitor an ECS

In some regions, Cloud Eye has been upgraded to the latest version. The alarm rule page has been optimized. The upgrade is being rolled out in other regions. For details, see the console. This section describes how to configure alarm rules in the latest version. For details about how to configure alarm rules in the earlier version, see Creating an Alarm Rule (Earlier Version).
After purchasing an ECS, configure an alarm rule to monitor key service metrics of the ECS.
Cloud Eye provides a quick entry for creating alarm rules to monitor ECS or BMS metrics. This step describes how to set parameters for creating an alarm rule. For more information, see Creating an Alarm Rule to Monitor a Server.
- On the Server Monitoring page, locate an ECS and choose More > Create Alarm Rule in the Operation column. Figure 7 Server monitoring list

- On the Create Alarm Rule page, the basic information is pre-filled by default. Configure alarm policy parameters as prompted and select an existing alarm template. Figure 8 Creating an alarm rule

- Configure alarm notifications. For details, see Creating an Alarm Rule.
Table 1 Alarm notification parameters Parameter
Example Value
Description
Alarm Notifications
Enabled
Whether to send an alarm notification when an alarm is triggered.
Notified By
Topic subscriptions or Account contact
Select a notification method and recipients. You can select notification policies, contact groups, or topic subscriptions. If you select Account contact, notifications will be sent to the mobile number and email address specified during registration.
Notification Window
00:00–23:59
If you select Contact groups or Topic subscriptions for Notified By, you need to set the notification window. The system sends notifications only within the notification window.
Trigger Condition
Generated alarm and Cleared alarm
This parameter is available when Notified By is set to Contact groups or Topic subscriptions. You can select Generated alarm, Cleared alarm, or both.
Notification Template
System template
This parameter is only available if you set Notified By to Contact groups or Topic subscriptions. You can select an existing template or create one to send alarm notifications.
- After the configuration is complete, view the alarm rule in the alarm rule list.
Step 4: View Alarm Records
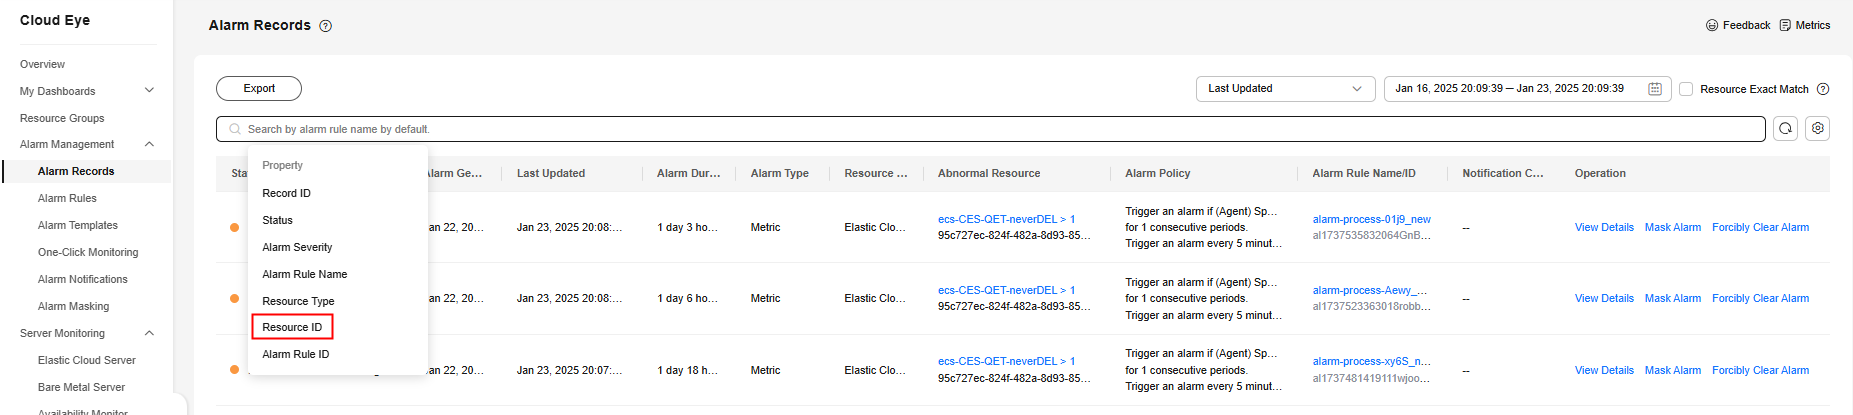
After receiving an alarm notification, you can search for the alarm in the alarm records by resource ID.
Follow-up Operation: Masking Alarm Notifications
If you do not need to receive notifications after an alarm is triggered, you can set a rule to mask the alarm notifications. After the masking rule is applied, only alarm records are generated.
- Log in to the Cloud Eye console.
- In the navigation pane, choose Alarm Management > Rule Settings.
In some regions, the path is Alarm Management > Alarm Rules.
- On the Alarm Rules page, locate the row containing the alarm rule to be masked, click More in the Operation column, and select Mask Alarm. In the displayed dialog box, configure Alarm Masking Duration and click OK. Figure 10 Masking an alarm rule

Related Information
For details about parameters for creating an alarm rule, see Creating an Alarm Rule (New Version).
You can mask alarm notifications for a resource or some alarm policies of the resource. For details, see Creating an Alarm Masking Rule.
Cloud Eye also provides the one-click monitoring for key monitoring metrics. For details, see One-Click Monitoring.
What is your overall rating for this page?
Thank you very much for your feedback. We will continue working to improve the documentation.See the reply and handling status in My Cloud VOC.
For any further questions, feel free to contact us through the chatbot.
Chatbot


