Overview
Service Not Enabled
Service Enabled
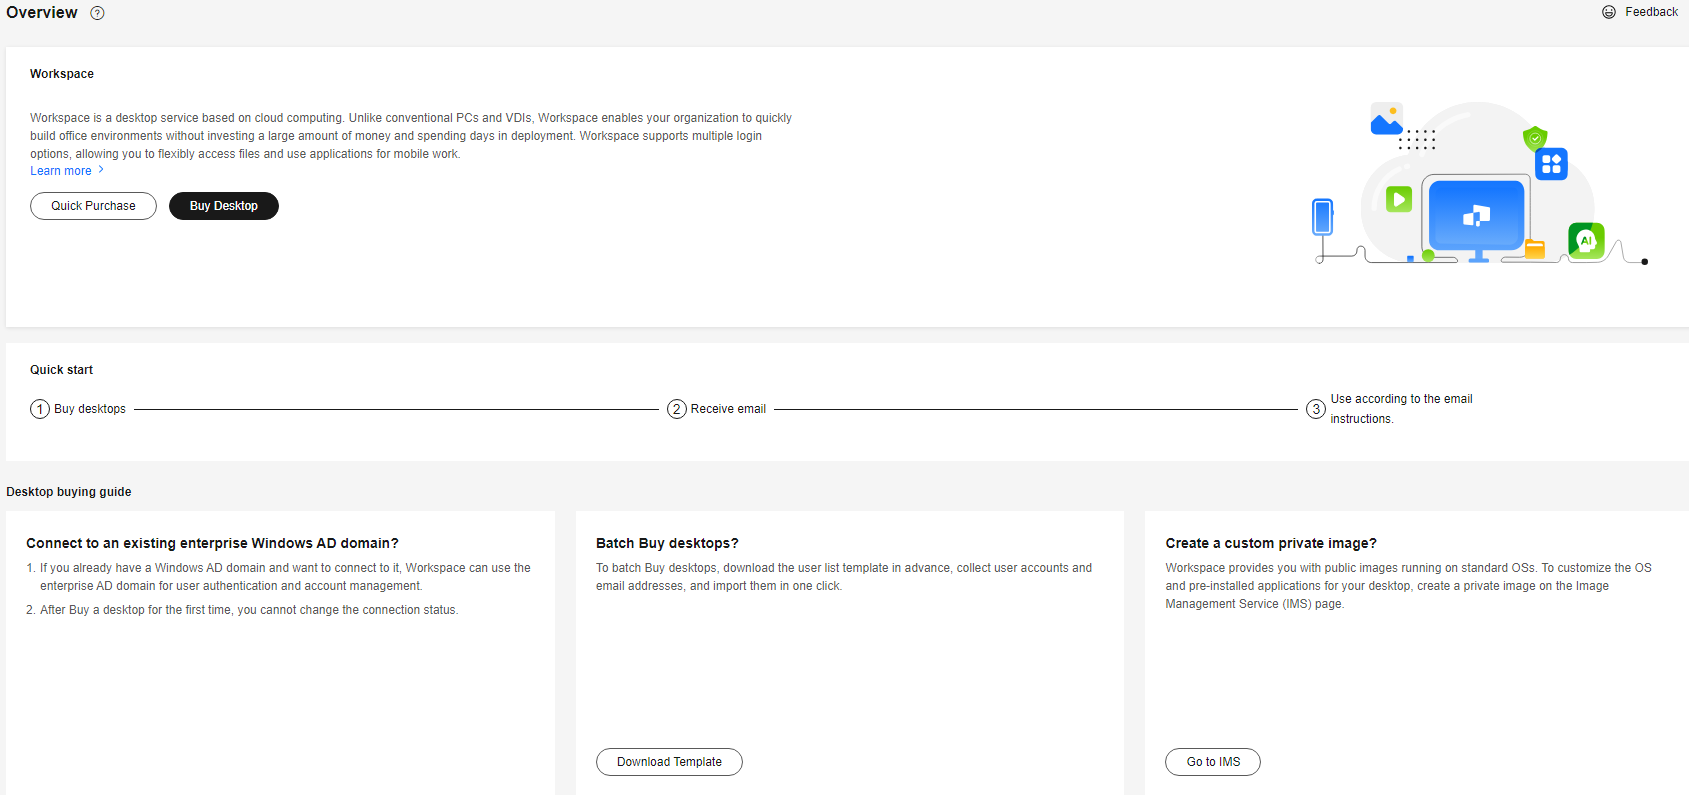
After purchasing a desktop, you can check the data trends, alarm notifications, and desktop monitoring information on the Overview page.
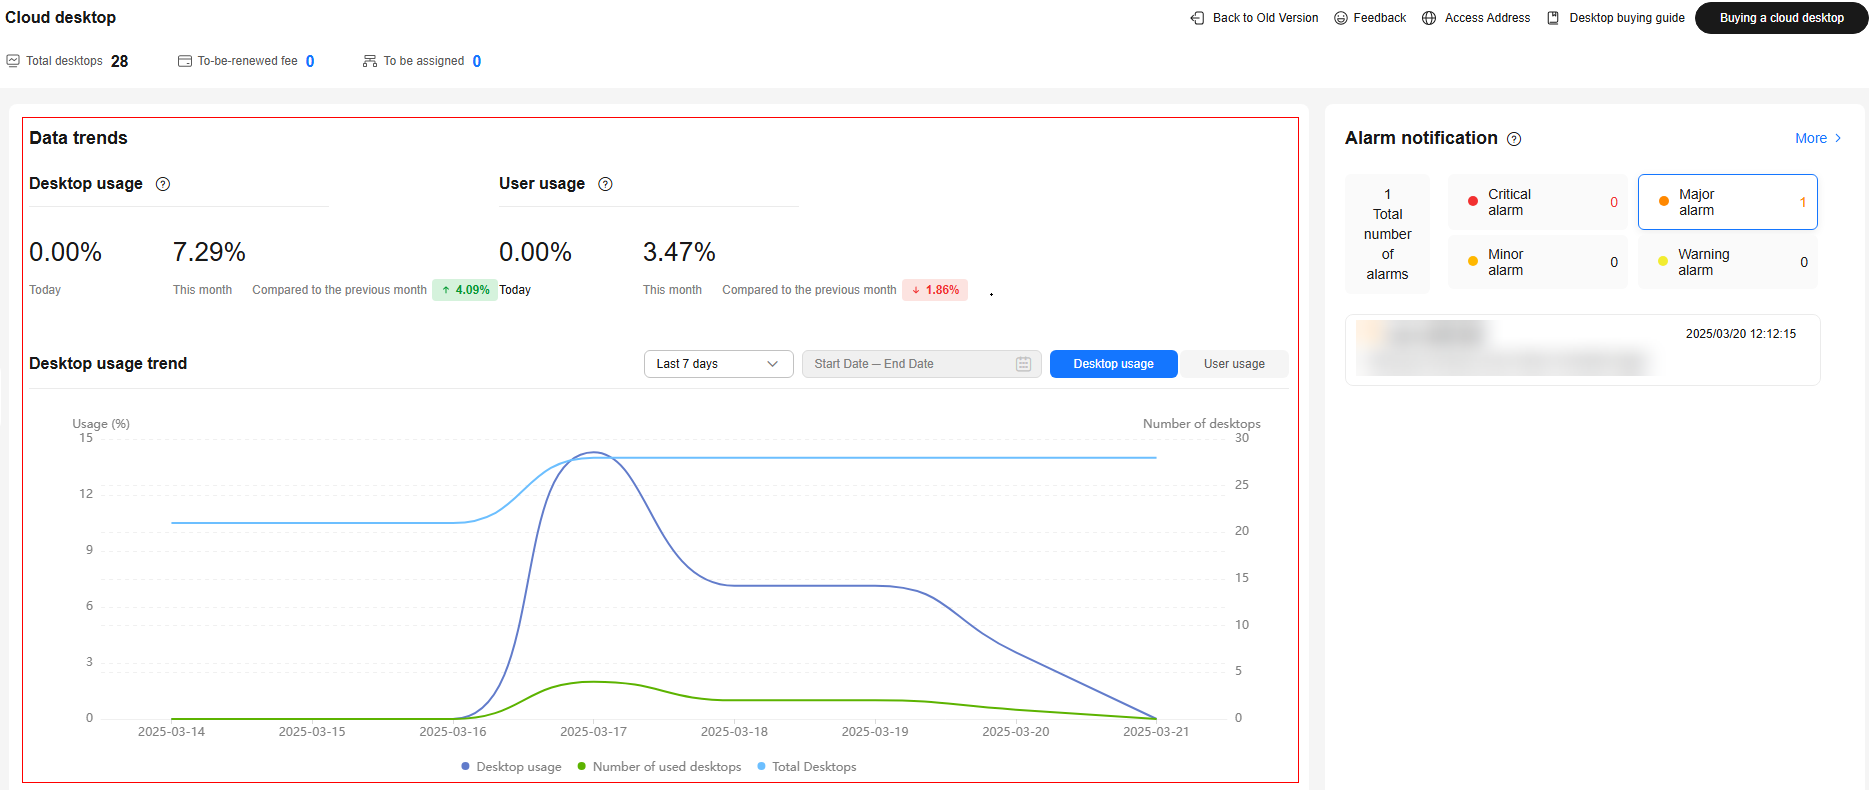
- In the Data trends area, you can view the desktop usage, desktop usage trend, and user usage. For details, see Figure 2 and Table 1.
|
Status Type |
Description |
|---|---|
|
Desktop Usage |
Displays the cloud desktop usage, number of used desktops, and total number of desktops in a specific period. You can check the statistics of today, last 7 days, last 30 days, or a customized period.
NOTE:
|
|
User Usage |
Displays the user usage, number of online users, and total number of users in a specific period. You can check the statistics of today, last 7 days, last 30 days, or a customized period.
NOTE:
|
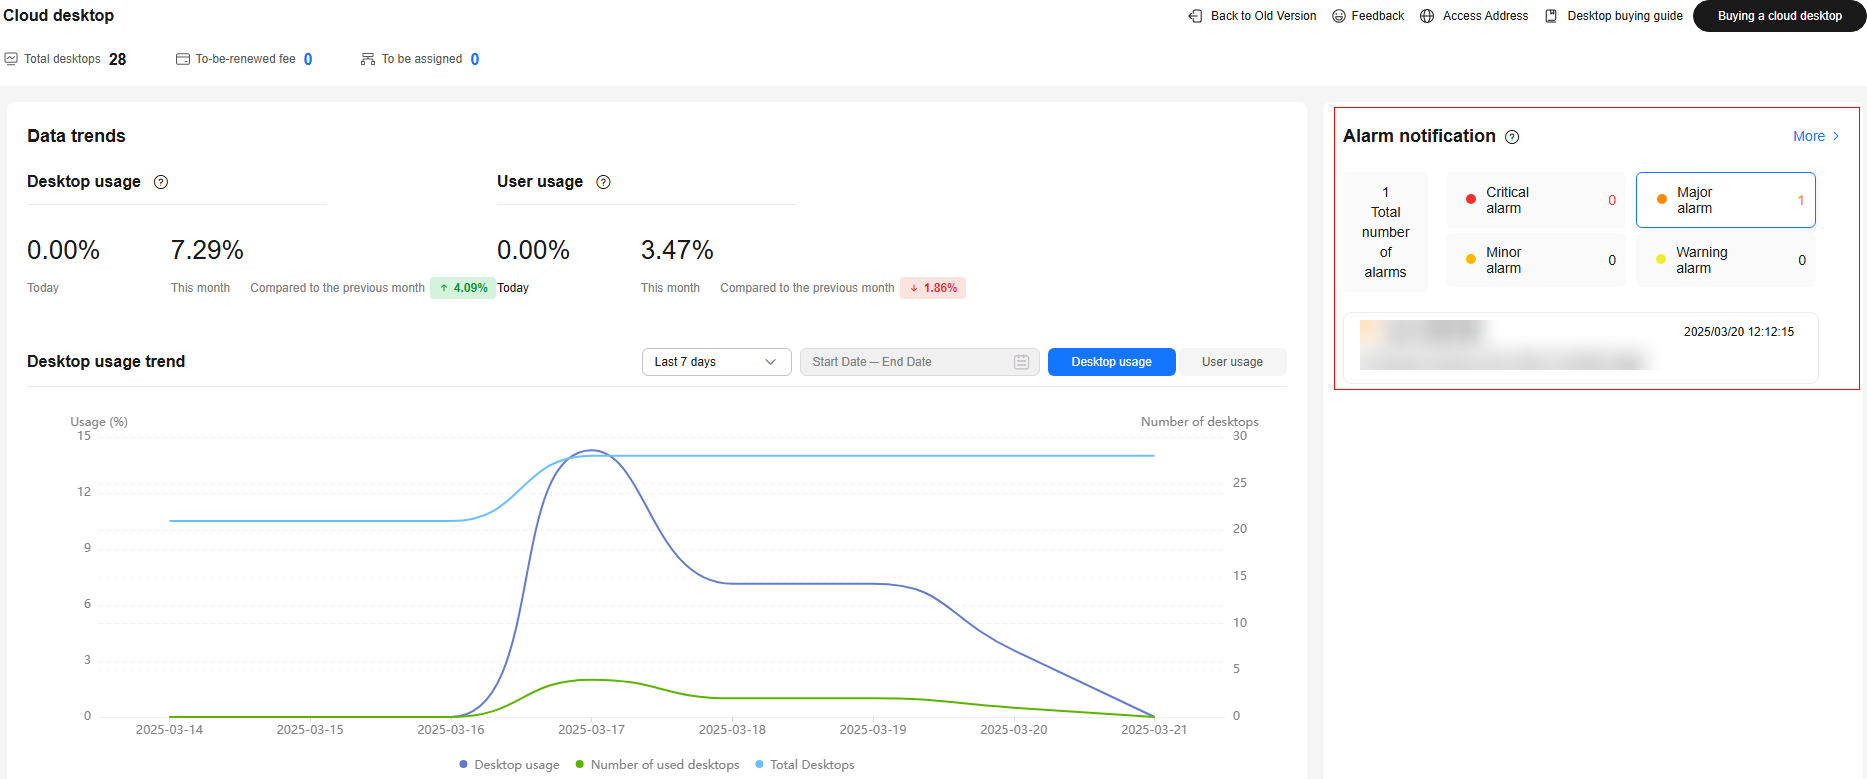
- In the Alarm notification area, you can view the total number of alarms and alarm severity of cloud desktops, as shown in Figure 3. To view the alarm details, you can click Details to go to the Cloud Eye console.
- In the Desktop Monitoring area, you can check the running status or login status statistics by desktop or desktop pool, as shown in Figure 4. For details, see Table 2.
Table 2 Status description Status Type
Status
Description
Cloud desktop running status
Running
The desktop is working properly.
Stopped
The desktop has been stopped.
Hibernated
The desktop has been hibernated.
Faulty
The desktop is faulty.
Cloud desktop connection status
Connected
The desktop is in use.
Unconnected
The desktop is not in use.
Connection failed
The desktop cannot be connected to temporarily due to abnormal registration status.
- In the Desktop latency distribution area, you can view the latency trend within a specified period, as shown in Figure 5. For details, see Table 3.

- The cloud desktop latency is the network latency of cloud desktop sessions.
- Network latency: round-trip time (RTT) between a device and the access gateway. The data of this parameter can be viewed only on the client of 23.12.1.0 or later.
- You can view the network latency data of any day in the last 30 days.
Feedback
Was this page helpful?
Provide feedbackThank you very much for your feedback. We will continue working to improve the documentation.See the reply and handling status in My Cloud VOC.
For any further questions, feel free to contact us through the chatbot.
Chatbot


