
หน้านี้ยังไม่พร้อมใช้งานในภาษาท้องถิ่นของคุณ เรากำลังพยายามอย่างหนักเพื่อเพิ่มเวอร์ชันภาษาอื่น ๆ เพิ่มเติม ขอบคุณสำหรับการสนับสนุนเสมอมา
Managed Threat Detection
Managed Threat Detection
- Service Overview
- User Guide
- Best Practices
- FAQs
- General Reference
On this page
Show all
Help Center/
Managed Threat Detection/
User Guide/
Log Detection Management/
Viewing Log Detection Information
Copied.
Viewing Log Detection Information
This section describes how to view the log detection information.
Prerequisites
You have purchased MTD and created a detector in the current region.
Procedure
- Log in to the management console.
- Click
 in the upper left corner of the management console and select a region or project.
 - Click
 in the navigation pane on the left and choose Security & Compliance > Managed Threat Detection.
Figure 1 Home page of MTD
in the navigation pane on the left and choose Security & Compliance > Managed Threat Detection.
Figure 1 Home page of MTD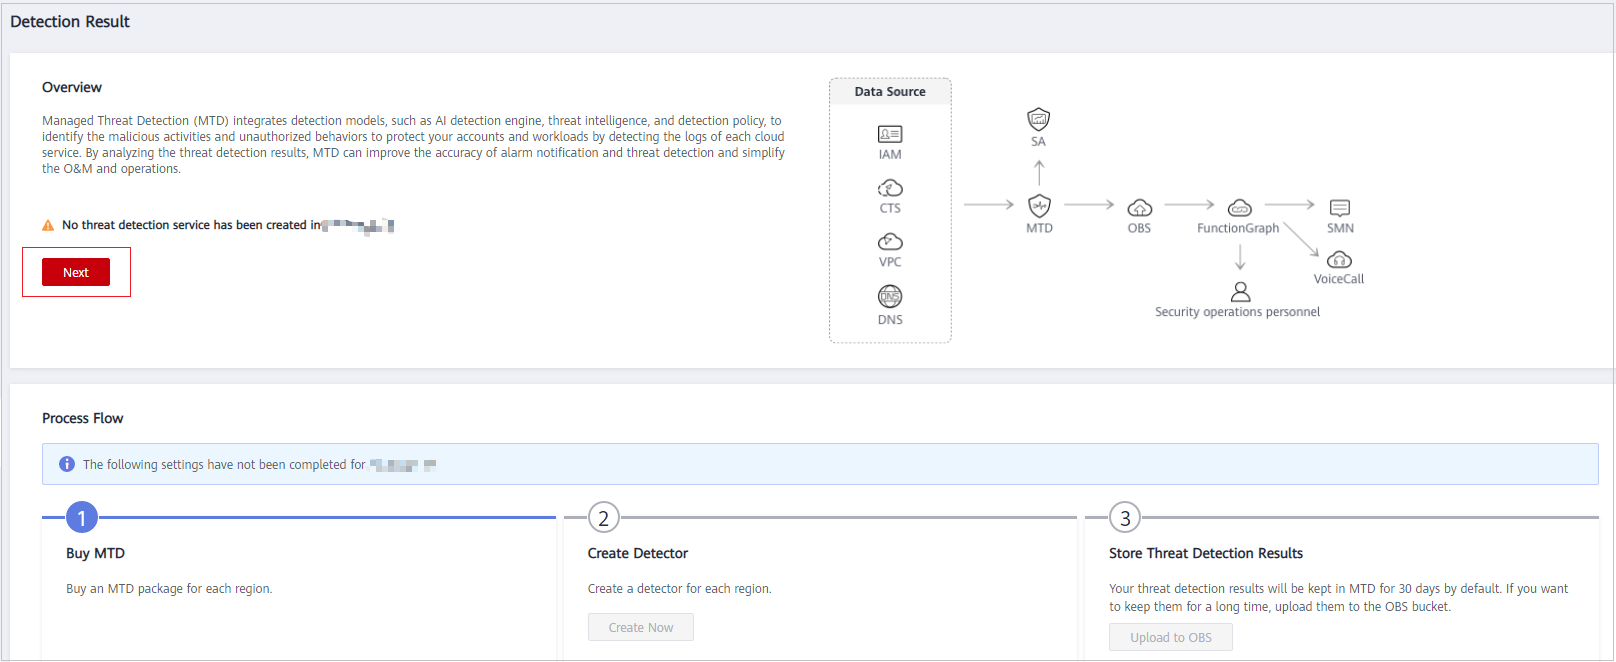
- Choose Settings > Detection Settings in the left navigation pane.
- In the Log Data Sources pane, you can view the services for which the log data source detection function is enabled or disabled.
Figure 2 Log data sources

Table 1 Log detection options Options
Description
Switch status
Whether to enable log detection for the service
 : Enabled
 : Disabled
Accumulated traffic
Size of detected logs since the log detection is enabled
Parent topic: Log Detection Management
Feedback
Was this page helpful?
Provide feedbackThank you very much for your feedback. We will continue working to improve the documentation.See the reply and handling status in My Cloud VOC.
The system is busy. Please try again later.
For any further questions, feel free to contact us through the chatbot.
Chatbot


