Enabling Logging
After you authorize AAD to access Log Tank Service (LTS), you can use the AAD logs recorded by LTS for quick and efficient real-time analysis, device O&M management, and analysis of service trends.
Prerequisites
LTS has been enabled. For details, see Managing Log Groups and Managing Log Streams.
Enabling AAD Logging
- Log in to the AAD console.
- In the navigation pane on the left, choose . The Dashboard page is displayed.
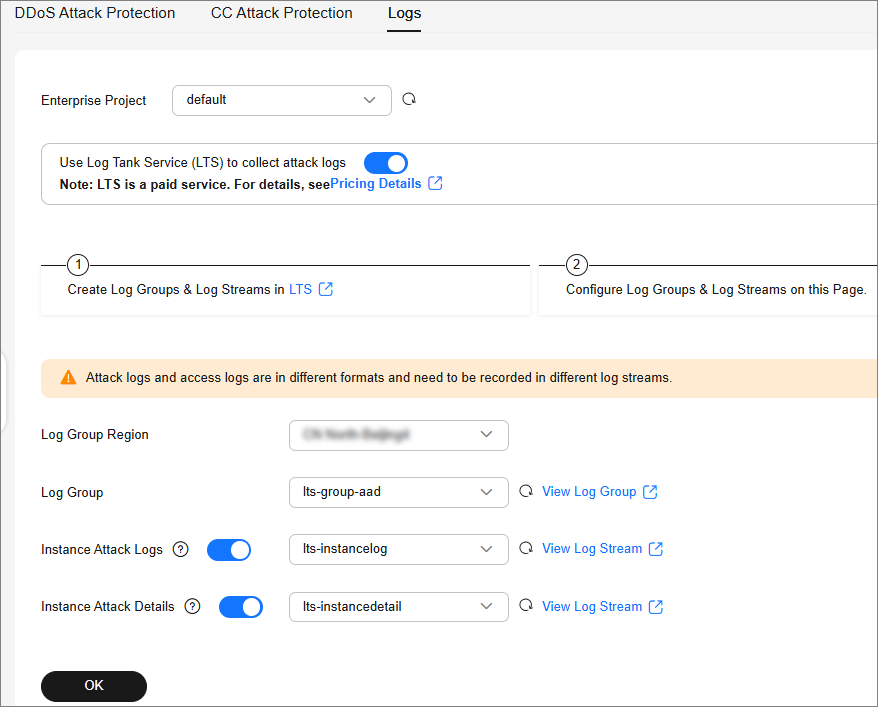
- Click Logs, enable full logs
 , and configure log groups and log streams. For details about related parameters, see Figure 1.
Table 1 AAD log parameters Parameter
Description
Enterprise Project
Select an enterprise project.
Log Group Region
Select the region to which the log group belongs.
Log Group
Select a log group or click View Log Group to go to the LTS console and create a log group.
Instance Attack Logs
Select a log stream or click View Log Stream to go to the LTS console and create a log stream.
An attack log includes information about event type, protective action, and attack source IP address of each attack. For details about the log fields, see Table 2.
Instance Attack Details
Select a log stream or click View Log Stream to go to the LTS console and create a log stream.
Instance attack details include the attack start time, end time, attack status, and attack type. For details about the fields, see Table 3.
- Click OK.
You can view protection logs on the LTS console.
Log Fields in LTS
This section describes the fields of AAD logs.
|
Field |
Description |
|---|---|
|
ip |
Attacked IP address |
|
ip_id |
ID of the attacked IP address |
|
attack_type |
Attack type |
|
attack_protocol |
This field is not used currently. The default value is 0. |
|
attack_start_time |
Time the attack starts, which is a timestamp accurate to millisecond. |
|
attack_status |
Attack status.
|
|
drop_kbits |
The minute-level maximum attack traffic, in bits. |
|
attack_pkts |
The minute-level maximum number of attack packets |
|
duration_elapse |
Duration of an ended security event, in seconds. |
|
end_time |
Time the attack ends, which is a timestamp accurate to millisecond. For an on-going security event, the value of this field is 0. |
|
max_drop_kbps |
Peak attack traffic, in Kbit/s. |
|
max_drop_pps |
Peak attack packets, in pps. |
|
Field |
Description |
|---|---|
|
attackStatus |
Attack status |
|
attackType |
Attack status
|
|
attackTypeDescCn |
Attack type, in Chinese. |
|
attackTypeDescEn |
Attack type, in English. |
|
attackUnit |
Attack unit |
|
attacker |
Attack source |
|
attackerKbps |
Peak attack traffic, in kbps. |
|
attackerPps |
Peak attack traffic, in pps. |
|
direction |
Log direction
|
|
dropKbits |
Total volume of discarded traffic, in kbits. |
|
dropPackets |
Total number of discarded packets. |
|
duration |
Attack duration, in seconds. |
|
handleTime |
Time when the log is processed. |
|
logTime |
Log time |
|
logType |
Log type |
|
maxDropKbps |
Peak value of discarded IP traffic, in kbps. |
|
maxDropPps |
Peak value of discarded IP traffic, in pps. |
|
port |
Port number |
|
startTimeAlert |
Start time of an exception |
|
timeScale |
Time identifier (identifier for minute-level processing time or hour-level processing time). |
|
valid |
Indicates whether logs are successfully parsed. |
|
writeTime |
Persistence time |
|
zoneIP |
Protected IP |
|
startTimeAttack |
Time when the attack starts |
|
startTimeKey |
ID of an attack starting at a certain time |
Feedback
Was this page helpful?
Provide feedbackThank you very much for your feedback. We will continue working to improve the documentation.See the reply and handling status in My Cloud VOC.
For any further questions, feel free to contact us through the chatbot.
Chatbot


