
Developing or O&M Databases
DAS provides Development Tool and Intelligent O&M to help you maintain and manage DB instances.
Development Tool is an easy-to-use database client. It provides diverse database development functions, including data and table structure synchronization, online editing, and intelligent prompts for SQL input.
Intelligent O&M is mainly designed for database administrators (DBAs) and provides the following database O&M functions: host and instance performance analysis, slow and all query logs analysis, real-time database performance analysis and diagnosis, historical data analysis, and more.
This section describes how to use DAS for RDS for MySQL instances.
Managing Databases
- Log in to the Huawei Cloud console.
- Click
 in the upper left corner and select a region and project.
 - Click
 in the upper left corner, and under Databases, click Data Admin Service.
 - In the navigation pane on the left, choose Development Tool.
You can also click Go to Development Tool on the overview page.
- Choose RDS and MySQL from the drop-down lists in the upper right corner.
- Locate the MySQL DB instance you want to log in to and click Log In in the Operation column.
Figure 1 Logging in to a database

- On the top menu bar, click Database Management and click Change to select a database you want to operate.
Figure 2 Database management

- Click the Objects tab to view objects such as tables, views, stored procedures, events, triggers, and functions.
Figure 3 Objects

For more operations, see Managing MySQL Databases.
Database O&M
Intelligent O&M is available for paid and free instances. Paid instances can enjoy more value-added functions. For details about how to set an instance as paid, see Setting an Instance as Paid.
The following describes how to use Intelligent O&M to view performance trend of an RDS for MySQL instance. For details, see Intelligent O&M.
- Log in to the Huawei Cloud console.
- Click in the upper left corner and select a region and project.
- Click in the upper left corner, and under Databases, click Data Admin Service.
- In the navigation pane, choose Intelligent O&M > Instance List.
Alternatively, on the Overview page, click Go to Intelligent O&M.
- In the upper right corner of the Instance List page, search for instances by engine type, instance name, or instance IP.
- Locate the target instance and click Details.
- On the Performance tab page, perform the following operations:
- Enable monitoring by seconds.
- Specifying metrics
You can check metrics and specify metrics to create charts.
Figure 5 Specifying metrics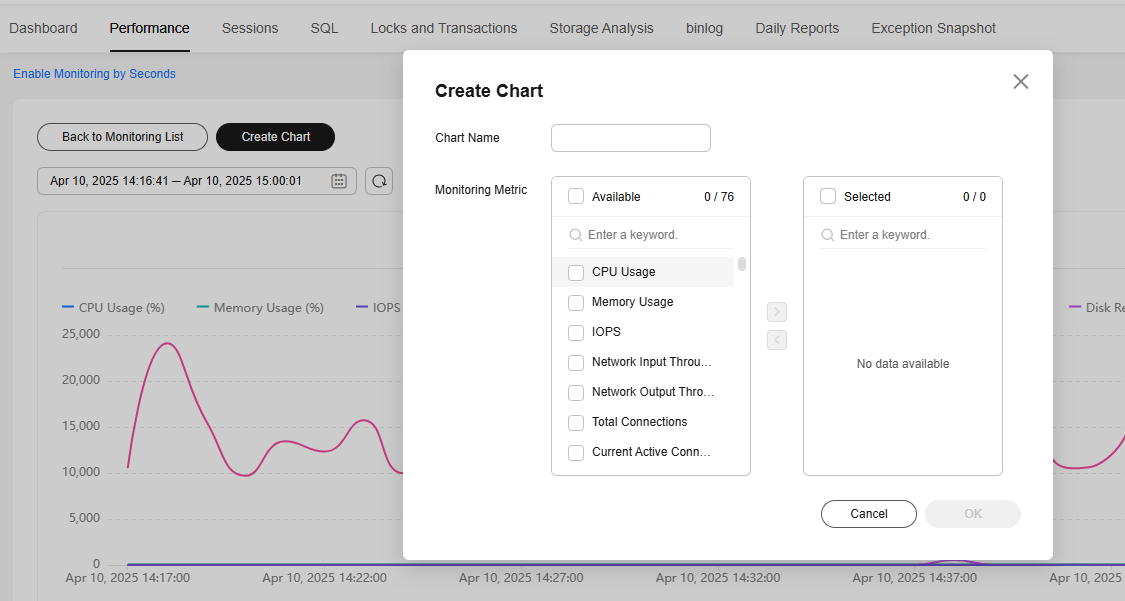
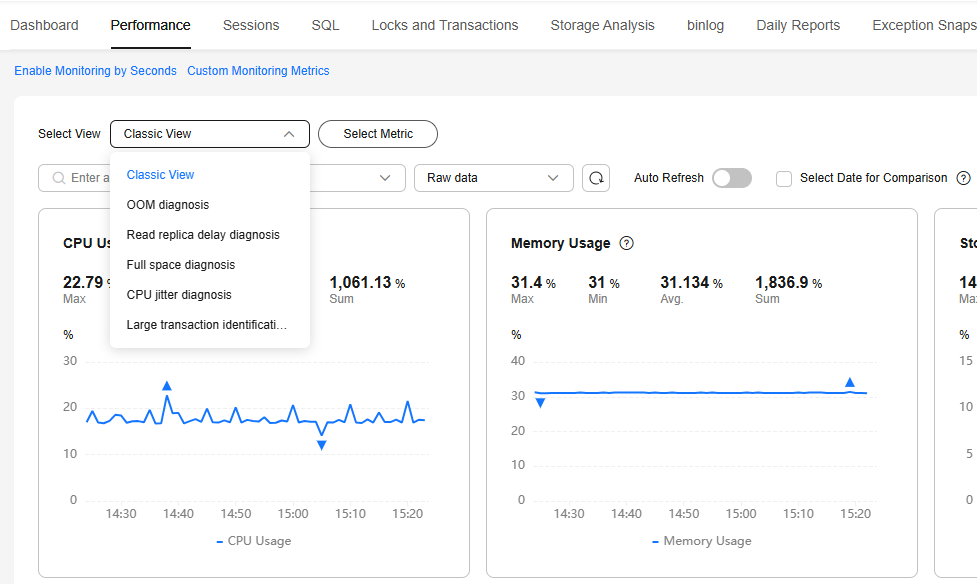
- You can select the classic, OOM diagnosis, read replica delay diagnosis, full space diagnosis, CPU jitter diagnosis, and large transaction identification and diagnosis views. Each view corresponds to a batch of preset metrics, which can help you diagnose DB instance problems.
Figure 6 Querying metrics by view
- View the trends in metrics in the same time range on different days.
You can select Select Date for Comparison, and specify the target comparison date and metrics to view trends in the metrics at the same time on different days.
You can place the pointer over a time point in the trend chart to view the metric at the time point on different days.Figure 7 Performance comparison
- View real-time performance of the instance.
You can deselect Select Date for Comparison, set a time range or select 1h, 3h, or 12h to view real-time metrics of the instance.
You can place the pointer over a time point in the trend chart to view the metric at this time point.Figure 8 Viewing performance metrics
- Customize the time range you wish to view.


Feedback
Was this page helpful?
Provide feedbackThank you very much for your feedback. We will continue working to improve the documentation.See the reply and handling status in My Cloud VOC.
For any further questions, feel free to contact us through the chatbot.
Chatbot


