Performance
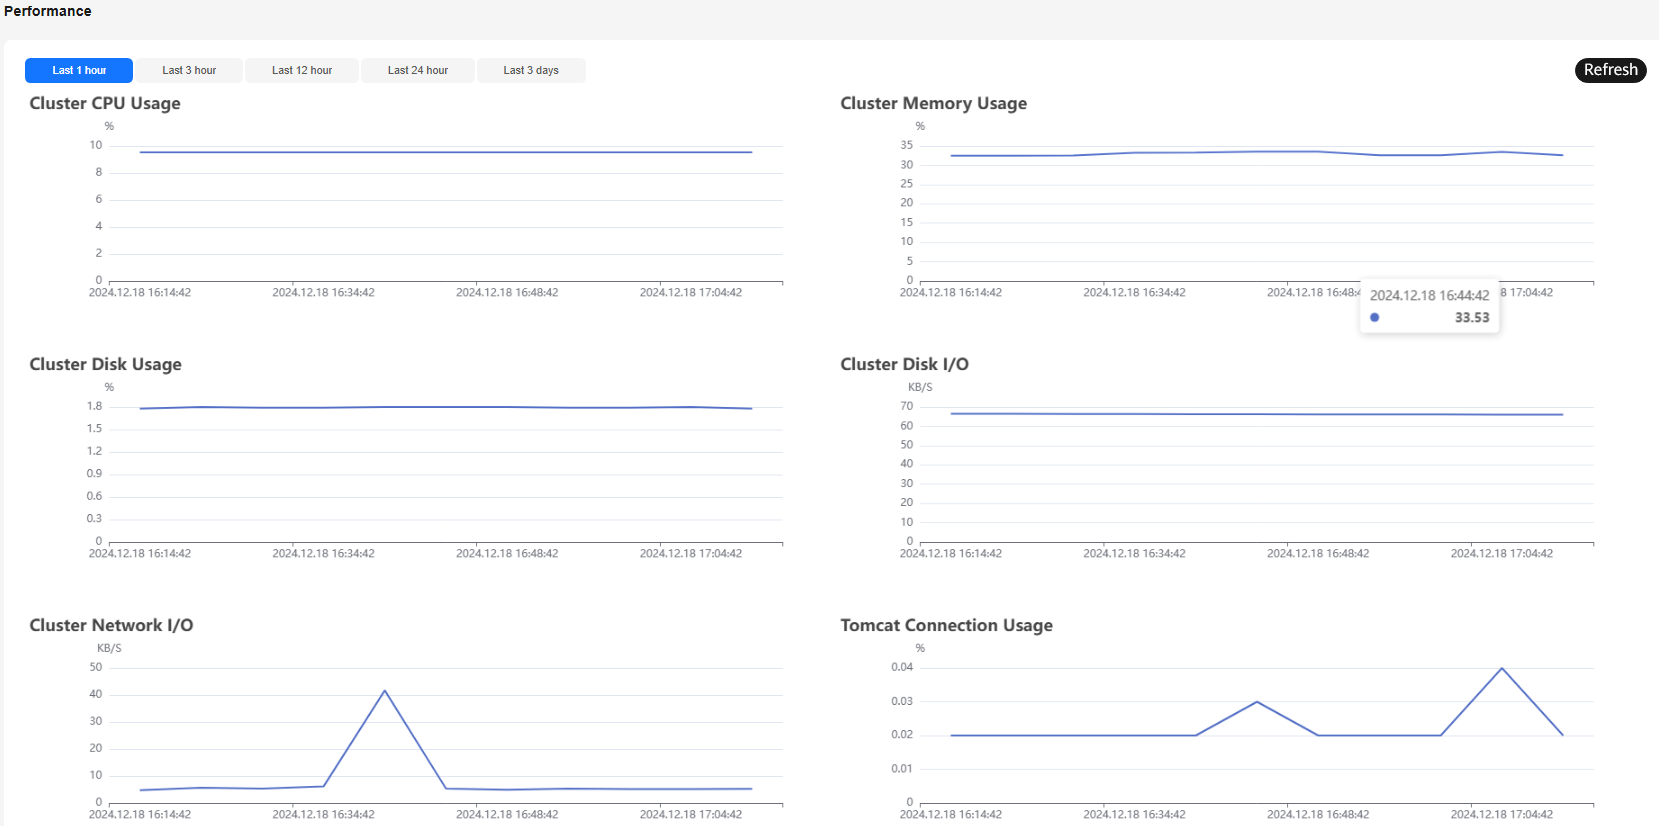
- CPU Usage (%)
- Memory Usage (%)
- Disk Usage (%)
- Disk I/O (KB/s)
- Network I/O (KB/s)
- Tomcat Connection Usage (%)
- Swap Disk Usage (only available for the memory edition)
- JVM Heap Memory Usage
- Read Requests in Running Queue (only available for the memory edition)
- Read Requests in Blocked Queue (only available for the memory edition)
You can select a time range to check the performance trends within this range.
The options are Last 1 hour, Last 3 hour, Last 12 hour, Last 24 hour, and Last 3 days. If you stay on the page for a long time, you can click Refresh in the upper right corner to update the monitoring data.

Feedback
Was this page helpful?
Provide feedbackThank you very much for your feedback. We will continue working to improve the documentation.See the reply and handling status in My Cloud VOC.
For any further questions, feel free to contact us through the chatbot.
Chatbot


