Nodes
In the navigation pane on the left of the O&M monitoring page, choose Monitoring > Nodes. The node monitoring page is displayed, showing the real-time consumption of nodes, memory, disks, disk I/O, and network I/O.
- Overview
On the Overview page, you can check the key resources of a specified node based on the node name, including the node name, CPU usage (%), memory usage (%), average disk usage (%), IP address, disk I/O (KB/s), TCP protocol stack retransmission rate (%), network I/O (KB/s), node status, and node monitoring status.
Figure 1 Overview page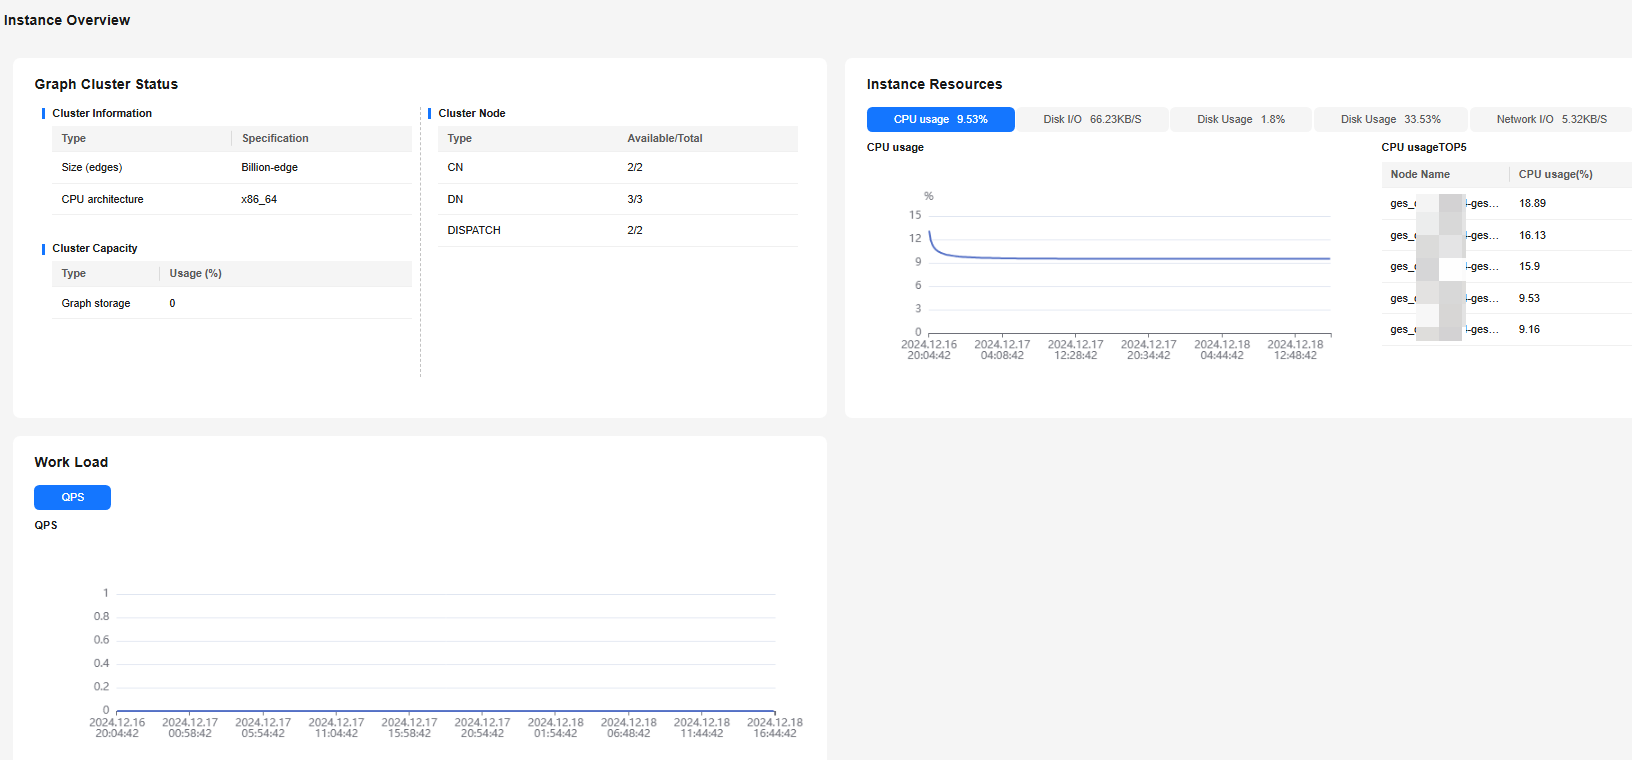
You can click Monitor on the right of the row where a specified node is located to access the monitoring overview page and check the performance metric topology of the node in a specified period.
The options are Last 1 hour, Last 3 hour, Last 12 hour, Last 24 hour, and Last 3 days. If you stay on the page for a long time, you can click Refresh in the upper right corner to update the monitoring data.
Figure 2 Node monitoring page
- Disks
On the Disks tab page, you can check the real-time disk usage of a node based on the node name and disk name. The metrics include Node Name, Disk Name, Disk Type, Disk Capacity (GB), Disk Usage (%), Disk Read Rate (KB/s), Disk Write Rate (KB/s), I/O Wait Time (ms), I/O Service Time (ms), I/O Usage (%), and Monitor.
The disk types include system disk, data disk, log disk, swap partition disk, backup disk, storage disk, and HyG disk.
Figure 3 Disks tab page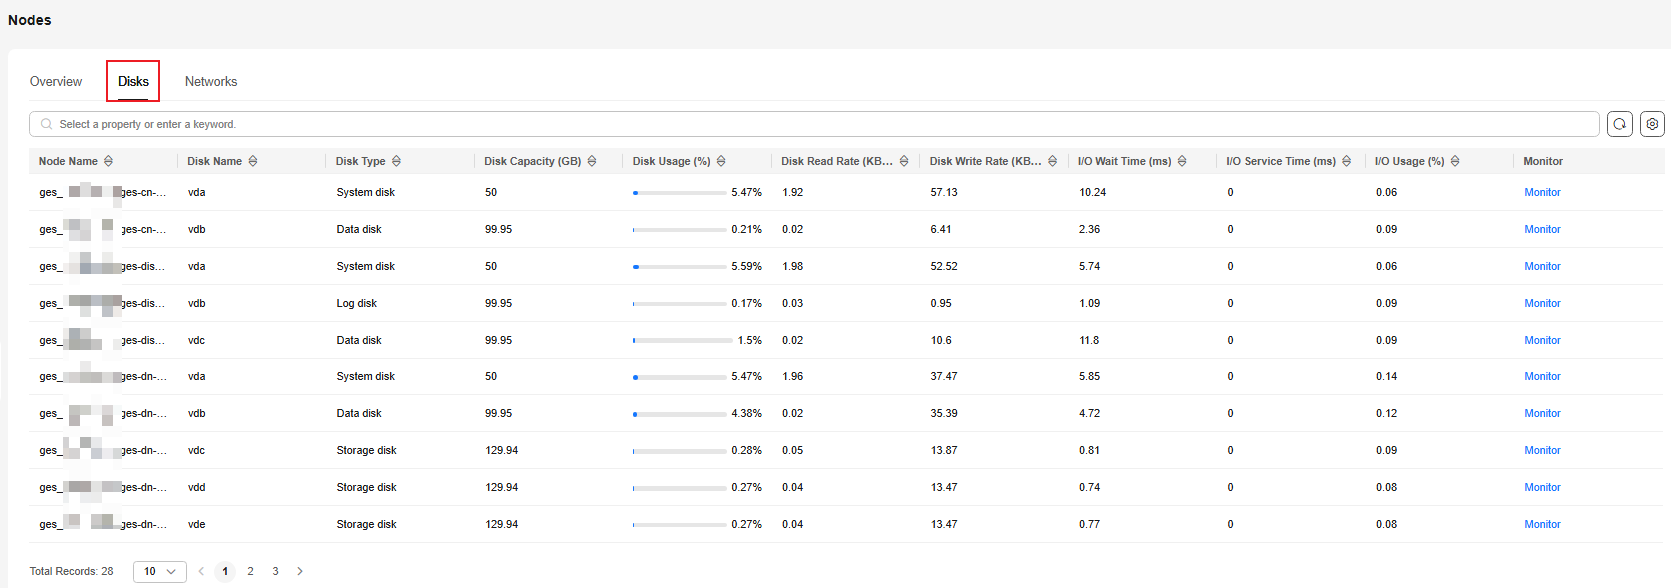
You can click Monitor on the right of the row where a specified node is located to access the monitoring overview page and check the performance metric topology of the disk in a specified period.
The options are Last 1 hour, Last 3 hour, Last 12 hour, Last 24 hour, and Last 3 days. If you stay on the page for a long time, you can click Refresh in the upper right corner to update the monitoring data.
Figure 4 Disks page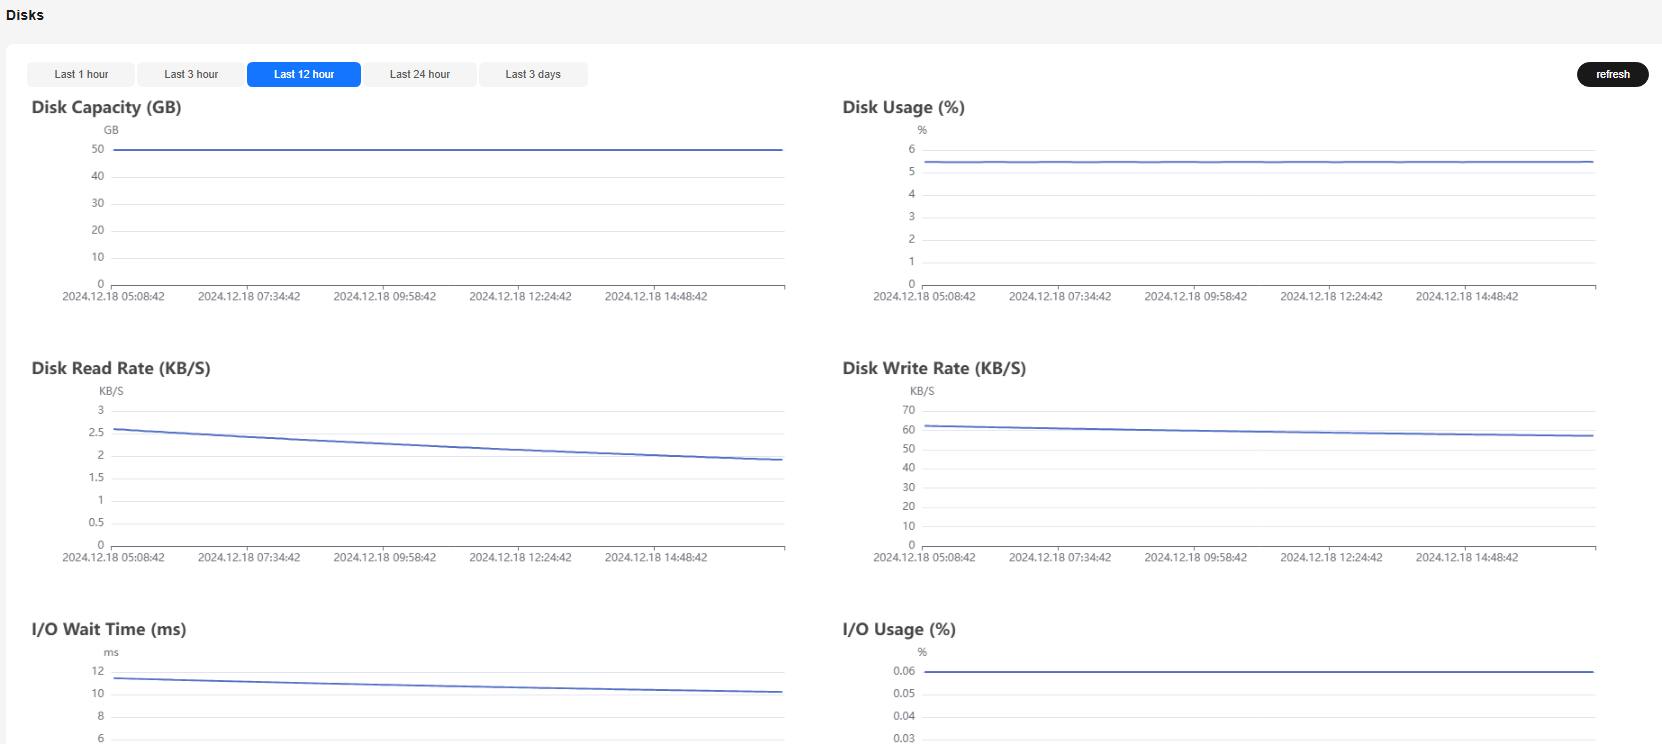

According to the disk usage displayed on the page, the sum of the used disk space and available disk space is not equal to the total disk space. This is because a small amount of space is reserved in each default partition for system administrators to use. Even if common users have run out of space, system administrators can log in to the system and use their space required for solving problems.
The disk capacity is collected by running the df command on Linux. The following is an example:

/dev/sda4: Used(5757444) + Available(540228616) != Total(569616888)
The parameters are as follows:
- Filesystem: path name of the device file corresponding to the file system. Generally, it is a hard disk partition.
- IK-blocks: number of data blocks (1,024 bytes) in a partition.
- Used: number of data blocks used by the disk.
- Available: number of available data blocks on the disk.
- Use%: percentage of the space used by common users. Even if the space is used up, the partition still reserves the space for system administrators.
- Mounted on: mount point of the file system.
- Networks
On the Networks tab page, you can check the real-time network resource consumption of a node based on the node and NIC name. The metrics include Node Name, NIC Name, NIC Status, Lost Received Packets, Receive Rate (KB/S), Transmit Rate (KB/S), and Monitor.
Figure 5 Networks tab page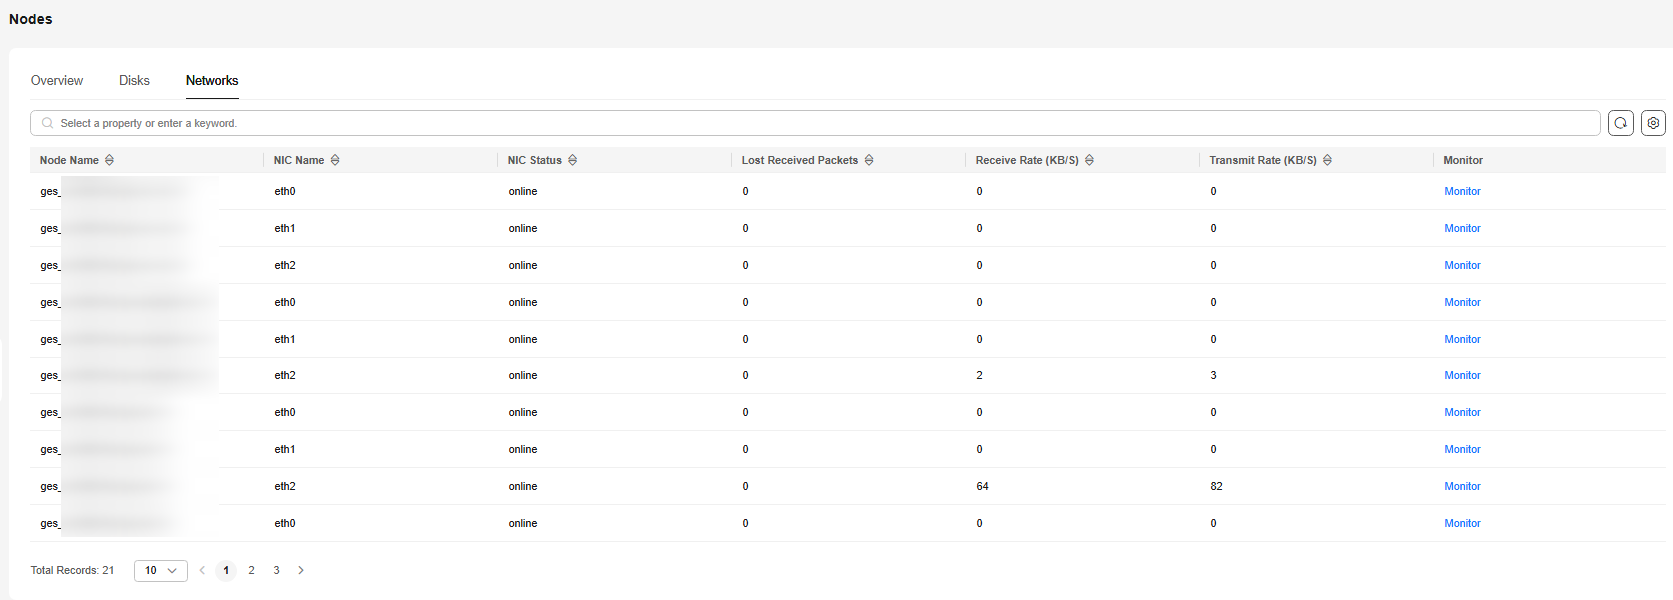
You can click Monitor on the right of the row where a specified node is located to access the monitoring overview page and check the performance metric topology of the network in a specified period.
The options are Last 1 hour, Last 3 hour, Last 12 hour, Last 24 hour, and Last 3 days. If you stay on the page for a long time, you can click Refresh in the upper right corner to update the monitoring data.
Figure 6 Networks page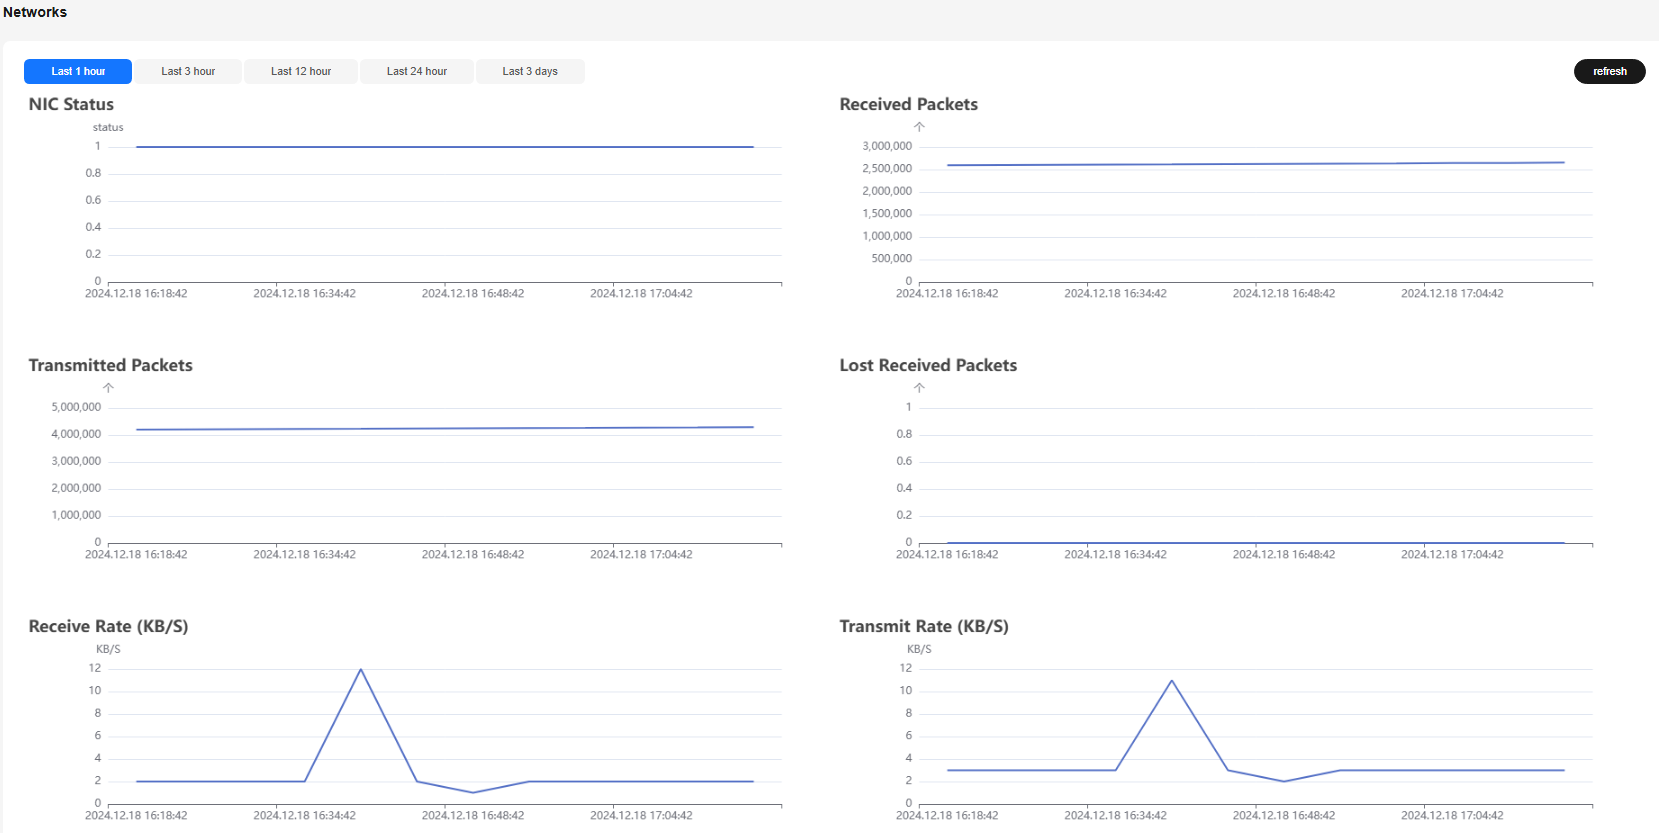
Feedback
Was this page helpful?
Provide feedbackThank you very much for your feedback. We will continue working to improve the documentation.See the reply and handling status in My Cloud VOC.
For any further questions, feel free to contact us through the chatbot.
Chatbot


