
Monitoring a Batch Job
Batch Processing: Scheduling Jobs
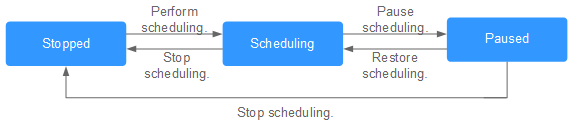
After developing a job, you can manage job scheduling tasks on the Monitor Job page. Specific operations include to run, pause, restore, or stop scheduling.
- Log in to the DLF console.
- In the navigation tree of the Data Development console, choose .
- Click the Batch Job Monitor tab.
- In the Operation column of the job, click Run/Pause/Restore/Stop.
Batch Processing: Scheduling the Depended Jobs
You can configure whether to start the depended jobs when scheduling a batch job on the job monitoring page. For details about how to configure depended jobs, see Configuring Job Scheduling Tasks.
- Log in to the DLF console.
- In the navigation tree of the Data Development console, choose .
- Click the Batch Job Monitor tab and select a job that has depended jobs.
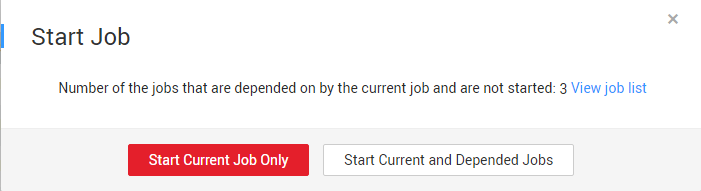
- In the Operation column of the job, click Schedule. You can start only the current job or start the depended jobs at the same time when scheduling the job.Figure 2 Starting a job
Batch Processing: Notification Settings
You can configure DLF to notify you of job success or failure. The following provides the method for configuring a notification task. You can also configure a notification task on the page. For details, see Managing a Notification.
- Log in to the DLF console.
- In the navigation tree of the Data Development console, choose .
- Click the Batch Job Monitor tab.
- In the Operation column of the job, choose . In the displayed dialog box, configure notification parameters. Table 1 describes the notification parameters.
- Click OK.
Batch Processing: Instance Monitoring
You can view the running records of all instances of a job on the Monitor Instance page.
- Log in to the DLF console.
- In the navigation tree of the Data Development console, choose .
- Click the Batch Job Monitor tab.
- In the Operation column of a job, choose to view the running records of all instances of the job.
Batch Processing: Scheduling Configuration
You can perform the following steps to go to the development page of a specific job.
- Log in to the DLF console.
- In the navigation tree of the Data Development console, choose .
- Click the Batch Job Monitor tab.
- In the Operation column of a job, choose .
Batch Processing: Job Dependency View
You can view the dependencies between jobs.
- Log in to the DLF console.
- In the navigation tree of the Data Development console, choose .
- Click the Batch Job Monitor tab.
- Click the job name and click the Job Dependencies tab. View the dependencies between jobs. Figure 3 Job dependencies view
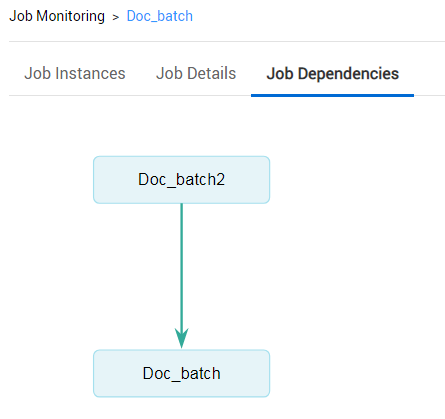
Click a job in the view. The development page of the job will be displayed.
Batch Processing: PatchData
A job executes a scheduling task to generate a series of instances in a certain period of time. This series of instances are called PatchData. PatchData can be used to fix the job instances that have data errors in the historical records or to build job records for debugging programs.
Only the periodically scheduled jobs support PatchData. For details about the execution records of PatchData, see PatchData Monitoring.

Do not modify the job configuration when PatchData is being performed. Otherwise, job instances generated during PatchData will be affected.
- Log in to the DLF console.
- In the navigation tree of the Data Development console, choose .
- Click the Batch Job Monitor tab.
- In the Operation column of the job, choose .
- Configure PatchData parameters. Table 1 shows the PatchData parameters. Figure 4 PatchData parameters
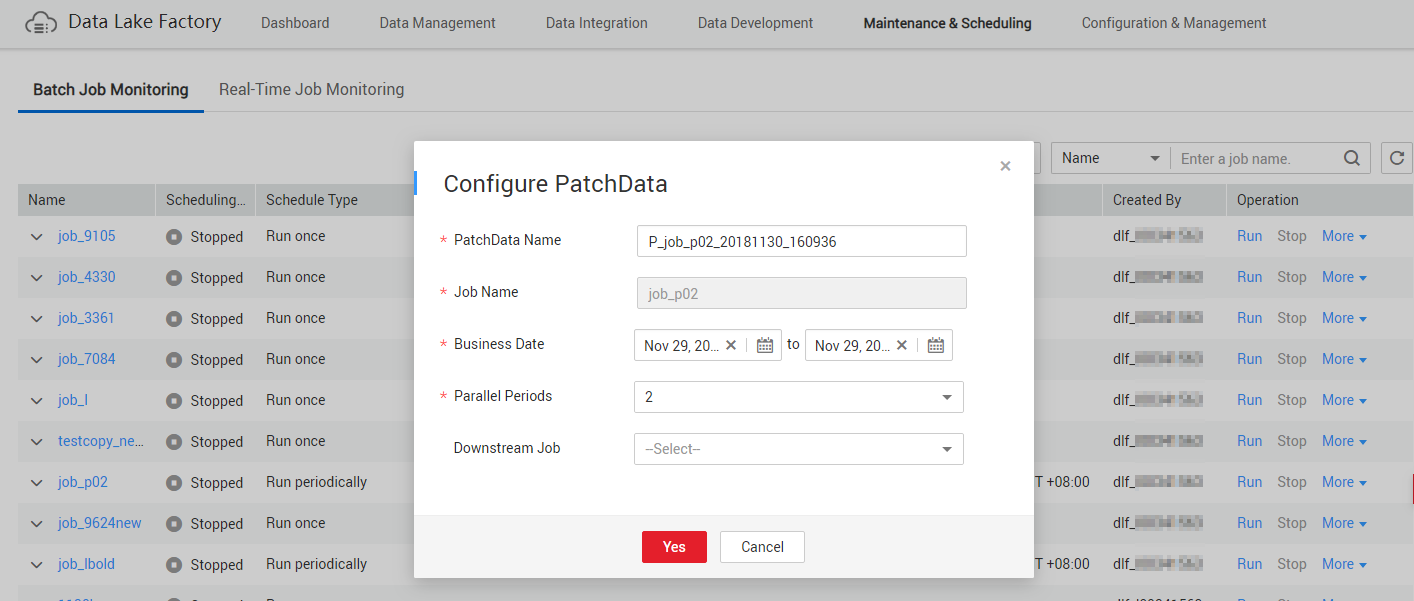
Table 1 Parameter description Parameter
Description
PatchData Name
Name of the automatically generated PatchData task. The value can be modified.
Job Name
Name of the job that requires PatchData.
Date
Period of time when PatchData is required.
Parallel Instances
Number of instances to be executed at the same time. A maximum of five instances can be executed at the same time.
Downstream Job Requiring PatchData
Downstream job (job that depends on the current job) that requires PatchData. You can select more than one downstream jobs.
- Click OK. The system starts to perform PatchData and the PatchData Monitoring page is displayed.
Batch Processing: Batch Processing Jobs
You can schedule and stop jobs and configure notification tasks in batches.
- Log in to the DLF console.
- In the navigation tree of the Data Development console, choose .
- Click the Batch Job Monitor tab.
- Select the jobs and click Schedule/Stop/Configure Notification to process the jobs in batches.
Batch Processing: Viewing Latest Instances
This function enables you to view the information about five instances that are running in a job.
- Log in to the DLF console.
- In the navigation tree of the Data Development console, choose .
- Click the Batch Job Monitor tab.
- Click
 in front of the job name. The page of the latest instance is displayed. You can view the details about the nodes contained in the latest instances.
Batch Processing: Viewing All Instances
You can view all running records of a job on the Running History page and perform more operations on instances or nodes based on site requirements.
- Log in to the DLF console.
- In the navigation tree of the Data Development console, choose .
- Click the Batch Job Monitor tab.
- Click a job name. The Running History page is displayed.
You can stop, rerun, continue to run, or forcibly run jobs in batches. For details, see Table 2.
When multiple instances are rerun in batches, the sequence is as follows:
- If a job does not depend on the previous schedule cycle, multiple instances run concurrently.
- If jobs are dependent on their own, multiple instances are executed in serial mode. The instance that first finishes running in the previous schedule cycle is the first one to rerun.
Figure 5 Batch operations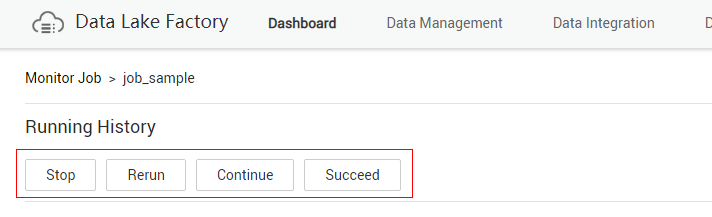
- View actions in the Operation column of an instance. Table 2 describes the actions that can be performed on the instance.
Table 2 Actions for an instance Action
Description
Stop
Stops an instance that is in the Waiting, Running, or Abnormal state.
Rerun
Reruns an instance that is in the Succeeded or Canceled.
View Waiting Job Instance
When the instance is in the waiting state, you can view the waiting job instance.
Continue
If an instance is in the Abnormal state, you can click Continue to begin running the subsequent nodes in the instance.
NOTE:This operation can be performed only when Failure Policy is set to Suspend the current job execution plan. To view the current failure policy, click a node and then click Advanced Settings on the Node Properties page.
Succeed
Forcibly changes the status of an instance from Abnormal, Canceled, Failed to Succeed.
View
Goes to the job development page and view job information.
- Click
 in front of an instance. The running records of all nodes in the instance are displayed.
 - View actions in the Operation column of a node. Table 3 describes the actions that can be performed on the node.
Table 3 Actions for a node Action
Description
View Log
View the log information of the node.
Manual Retry
To run a node again after it fails, click Retry.
NOTE:This operation can be performed only when Failure Policy is set to Suspend the current job execution plan. To view the current failure policy, click a node and then click Advanced Settings on the Node Properties page.
Succeed
To change the status of a failed node to Succeed, click Succeed.
NOTE:This operation can be performed only when Failure Policy is set to Suspend the current job execution plan. To view the current failure policy, click a node and then click Advanced Settings on the Node Properties page.
Skip
To skip a node that is to be run or that has been paused, click Skip.
Pause
To pause a node that is to be run, click Pause. Nodes queued after the paused node will be blocked.
Resume
To resume a paused node, click Resume.
Feedback
Was this page helpful?
Provide feedbackThank you very much for your feedback. We will continue working to improve the documentation.See the reply and handling status in My Cloud VOC.
For any further questions, feel free to contact us through the chatbot.
Chatbot


