
TOP SQL
After Collect All Query Logs is enabled, you can filter, search for, and analyze SQL statements in multiple dimensions on the SQL Explorer page. Top SQL helps you locate exceptions.
Usage Notes
- If you did not subscribe to advanced Intelligent O&M, you can only view data of the last hour. The data will be automatically deleted when it expires. After subscribing to advanced Intelligent O&M, you can view top SQL statements of a custom period within one day.
- All SQL statements are constrained by the memory buffer. When service volume is high, buffer overflow may result in dropped records.
- Any SQL statement that exceeds the upper limit will be discarded by default.
You can set rds_sql_tracer_max_record_size to specify the upper limit. For details, see Modifying Parameters of a TaurusDB Instance.
Procedure
- Log in to the console.
- Click
 in the upper left corner and select a region and project.
 - Click
 in the upper left corner, and under Databases, click Data Admin Service.
 - In the navigation pane, choose Intelligent O&M > Instance List.
Alternatively, on the Overview page, click Go to Intelligent O&M.
- In the upper right corner of the Instance List page, search for instances by engine type, instance name, or instance IP.
- Locate the target instance and click Details. The Dashboard page is displayed.
- Choose SQL > Top SQL.
If Collect All Query Logs is disabled, DAS cannot collect all SQL statements for analysis. You can click Log Settings and enable Collect All Query Logs.
Figure 1 Log Settings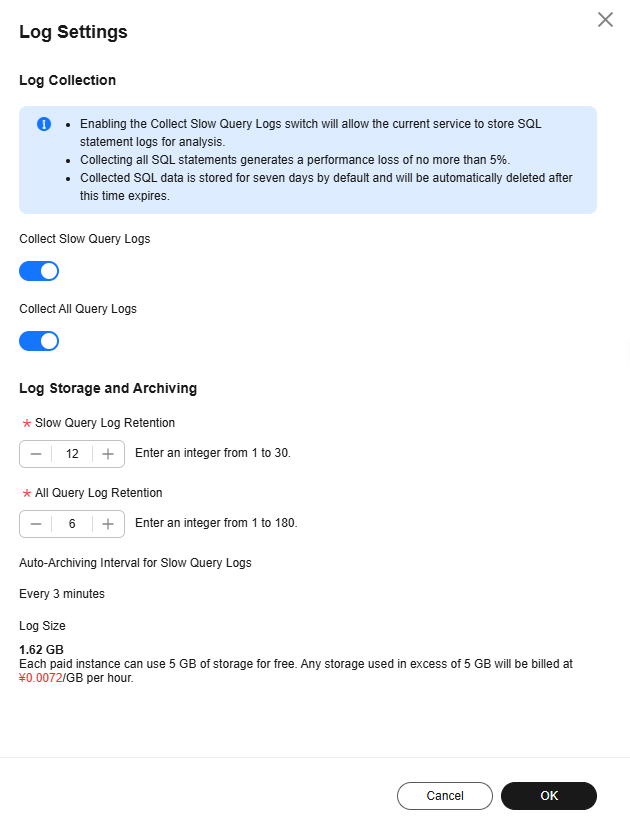

Collect All Query Logs takes effect once it is enabled.
To disable Collect All Query Logs, click Log Settings and toggle off the switch.
- On the Top SQL tab page, view execution duration of top SQL statements.
- You can select Last 1 hour, Last 3 hours, Last 6 hours, or Last 12 hours. You can also select other time ranges, but the interval must be within one day.
Figure 2 TOP SQL
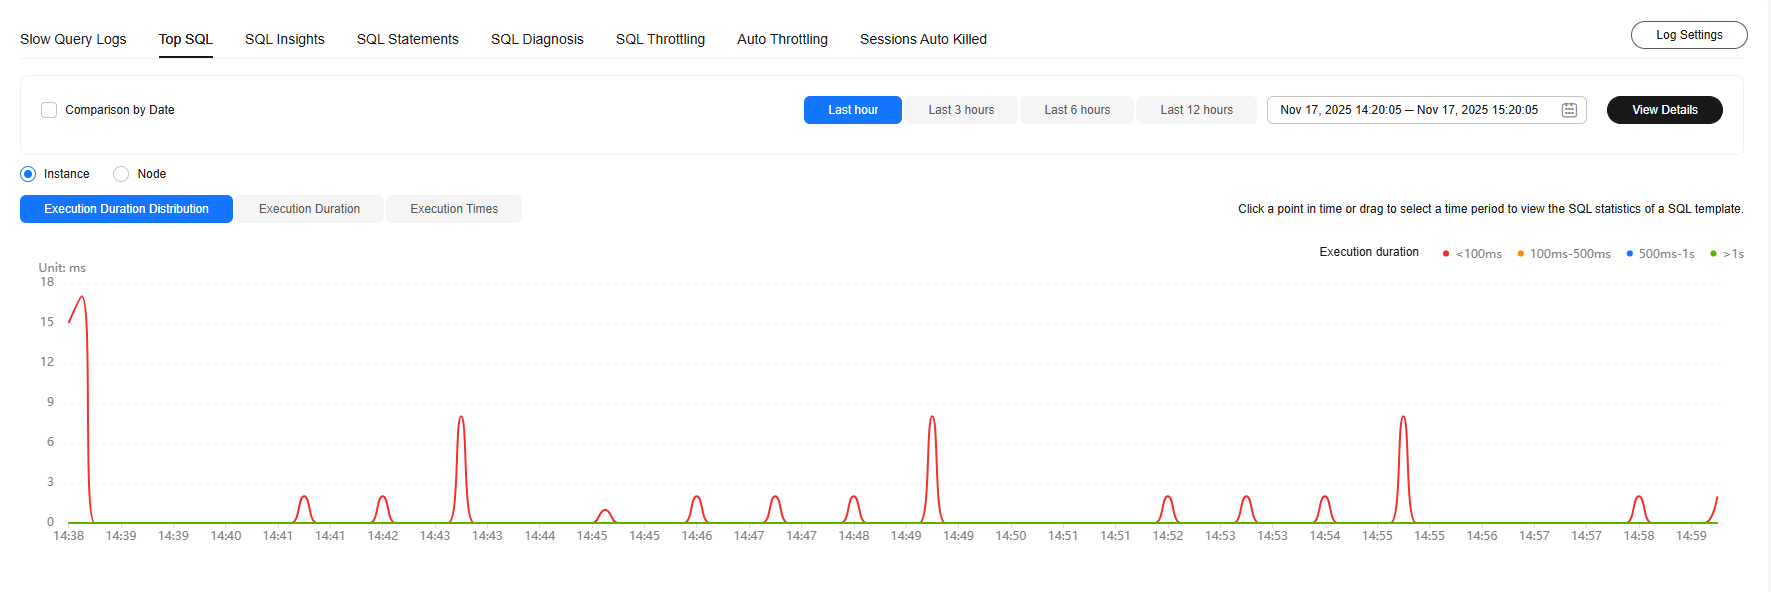
The execution duration distribution displays the execution duration distribution of all SQL statements within the selected time range. The duration ranges are as follows:
- < 100 ms: SQL statement executions when the duration is less than 100 ms
- 100 ms–500 ms: SQL statement executions when the duration is greater than or equal to 100 ms and less than 500 ms
- 500 ms–1s: SQL statement executions when the duration is less than 1s and greater than or equal to 500 ms
- > 1s: SQL statement executions when the duration is greater than 1s
SQL statistics in the four elapsed time lengths are collected over the time range you specified.
- If you select Last hour, SQL statement executions are calculated every 10 seconds.
- If you select Last 6 hours, SQL statement executions are calculated every minute.
- If you select a time range longer than 6 hours, SQL statement executions are calculated every 5 minutes.
Select By instance or By node to view execution duration distribution. You can change node to view its execution duration distribution. The primary node is selected by default. If you want to view the execution duration distribution of other nodes, click Change Node.
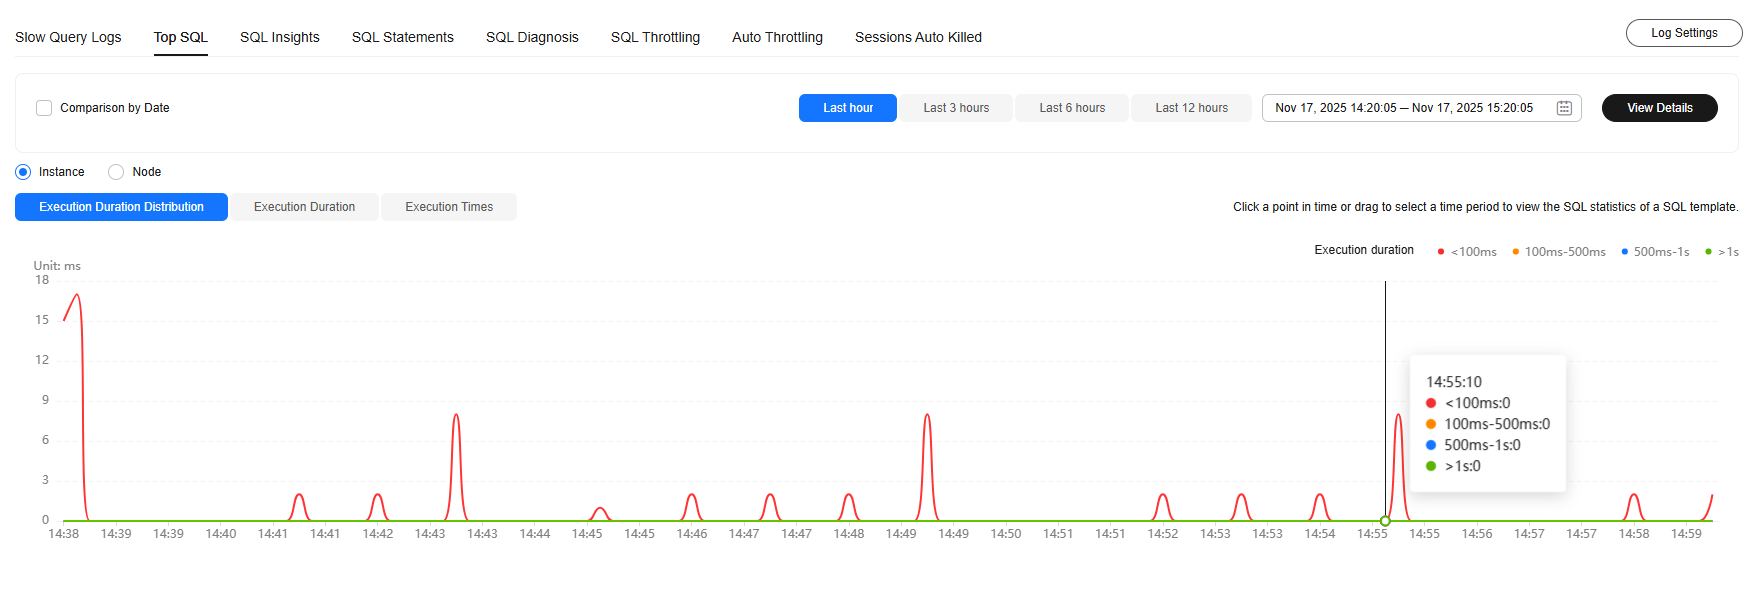
- Hover your mouse at any point in time on the graph to view top SQL templates at that time.
Figure 3 Viewing top SQL statements at a specific point in time
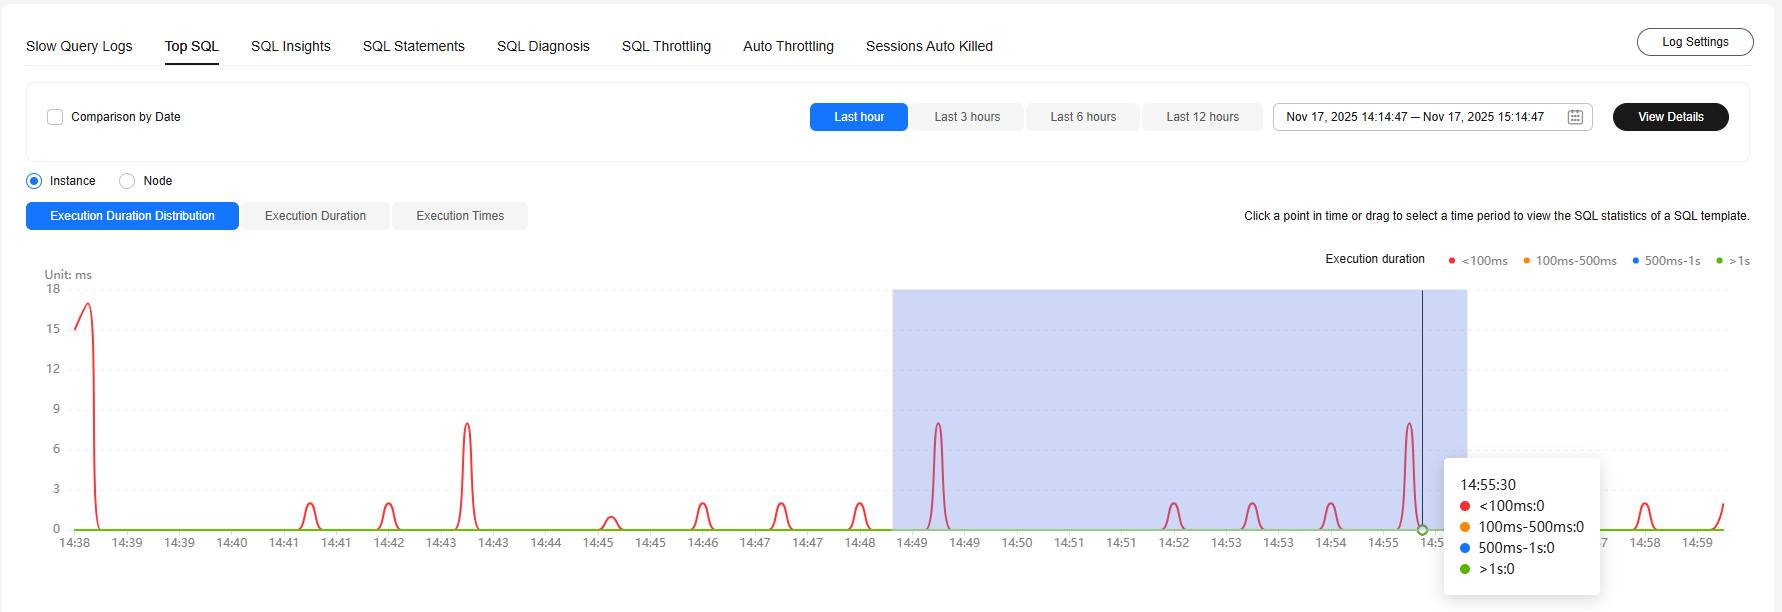
- Specify a time range using your mouse on the graph, and you will see top SQL statements during that time range.
Figure 4 Viewing top SQL statements in a specified time range
- Select Comparison by Date in the upper left corner to compare and analyze distribution of top SQL statements of the current instance in the same time range on different days.
Figure 5 Top SQL comparison
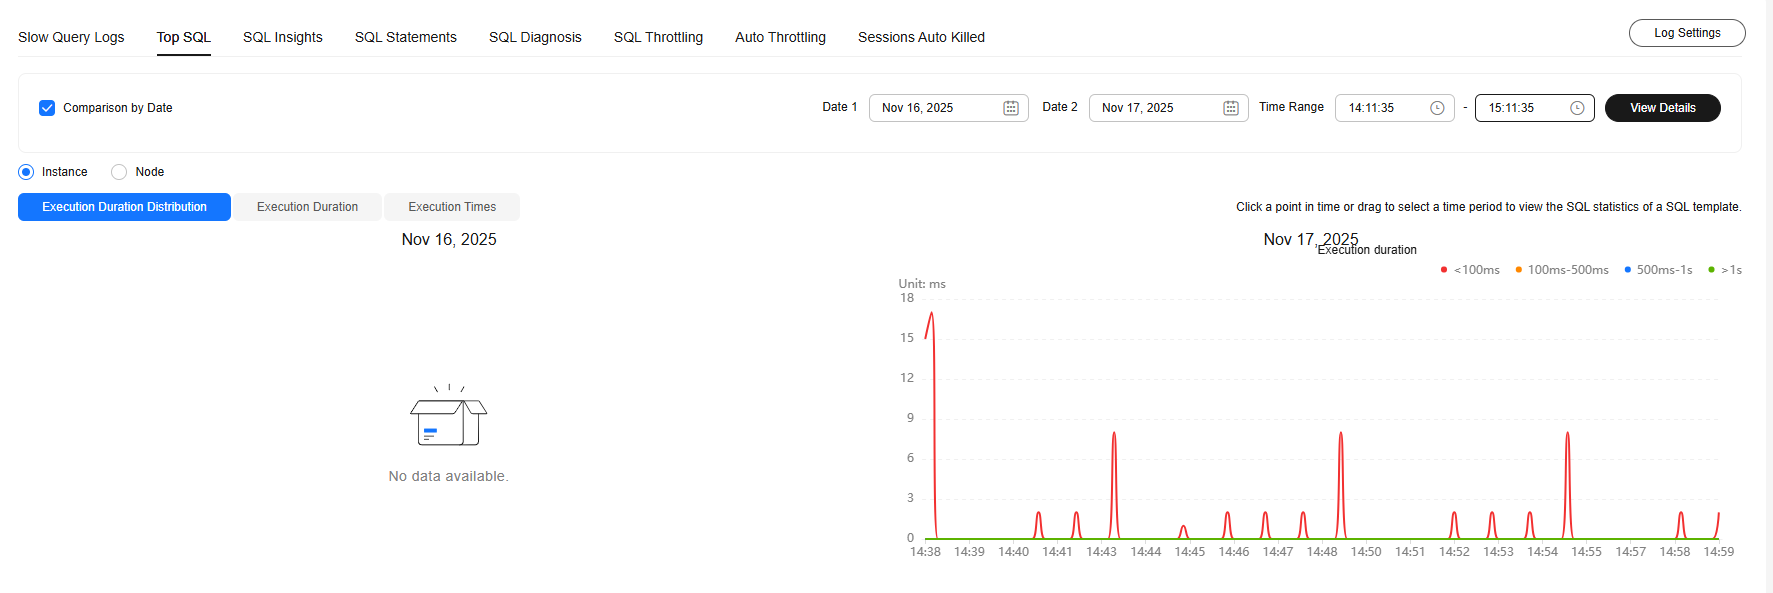
- You can select Last 1 hour, Last 3 hours, Last 6 hours, or Last 12 hours. You can also select other time ranges, but the interval must be within one day.
- View and export SQL templates, for example, database names, SQL operation types, total executions, average execution duration, average lock wait duration, and average number of scanned rows.
- View SQL templates after selecting a SQL template, database, and SQL type.
Figure 6 SQL template
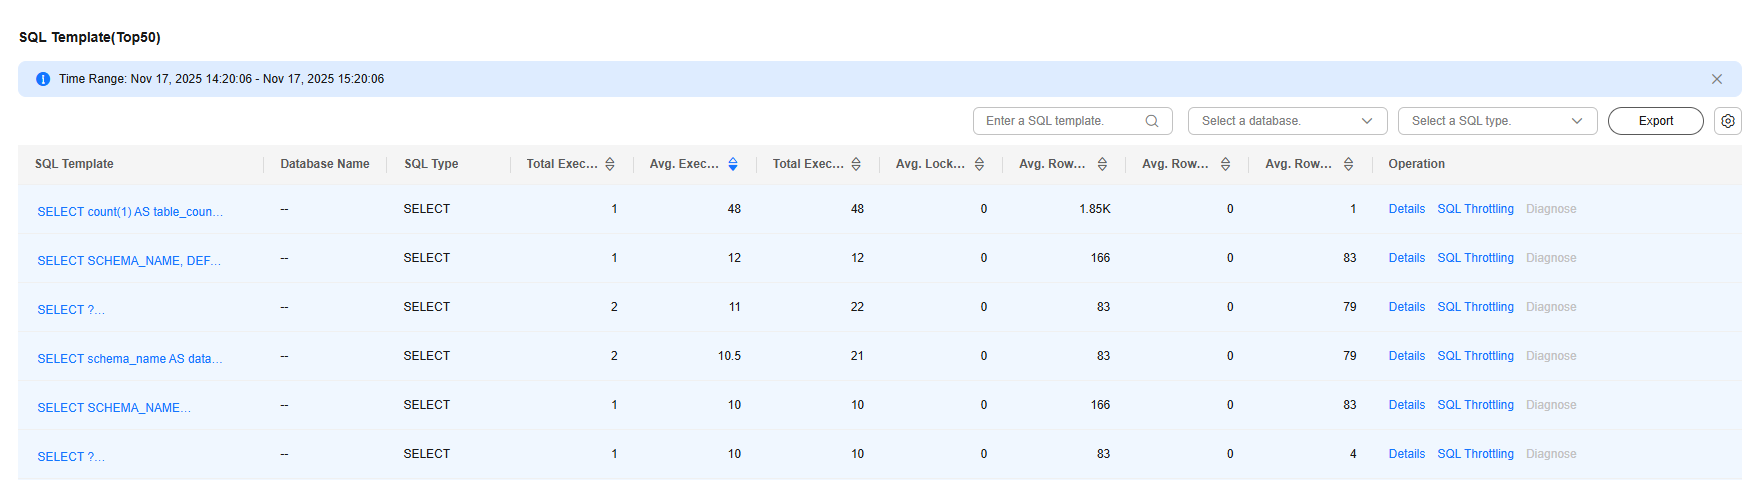
- In the SQL template list, locate a SQL template and click Details to view information such as the total execution, average rows scanned, and average execution duration.
- Locate a SQL template and click SQL Throttling in the Operation column to create a SQL throttling rule. For details, see SQL Throttling.
- In the SQL template list, locate a SQL template and click Diagnose to view details such as the execution plan and suggestions for tuning indexes and SQL statements.
- Locate a SQL template and click Export in the Operation column to export the SQL template.
- View SQL templates after selecting a SQL template, database, and SQL type.
Feedback
Was this page helpful?
Provide feedbackThank you very much for your feedback. We will continue working to improve the documentation.See the reply and handling status in My Cloud VOC.
For any further questions, feel free to contact us through the chatbot.
Chatbot


