
Help Center/
Huawei Cloud Astro Canvas/
User Guide/
Interaction Configuration/
Interactions Between Widgets
Updated on 2025-03-24 GMT+08:00
Interactions Between Widgets
Scenario
Interactions between widgets are the interaction events between different widgets on the same page. Widgets can function as triggers and responders for each other. Widget behaviors, global variables, and custom actions can be defined based on user-defined events.
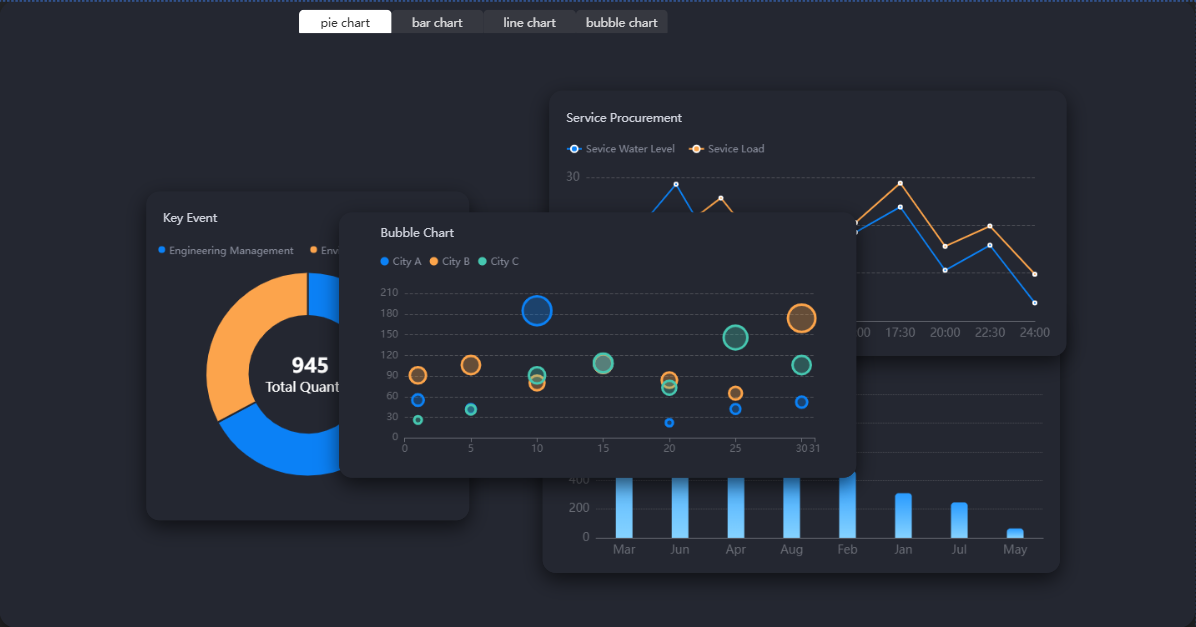
This section describes how to configure the interaction between widgets by adding multiple widgets in the same area and using tab widget to switch between widgets to be displayed on different tabs.
Interactions Between Widgets
- Create a blank page. For details, see Creating a Page Using an Empty Canvas.
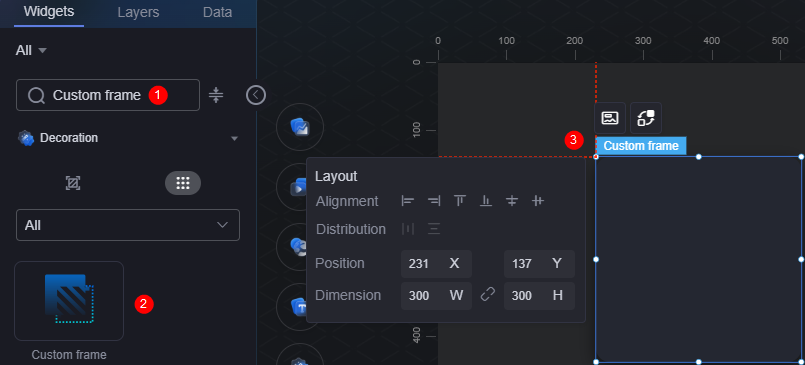
- On the large screen development page, drag the Custom Frame widget from All > Decorate to the canvas.
Figure 1 Dragging Custom Frame to the canvas
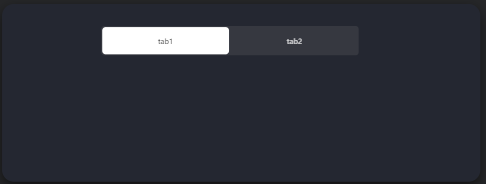
- Drag the Tabs widget from the All > Menu to the Custom Frame widget.
Figure 2 Dragging the Tabs widget to the Custom Frame widget
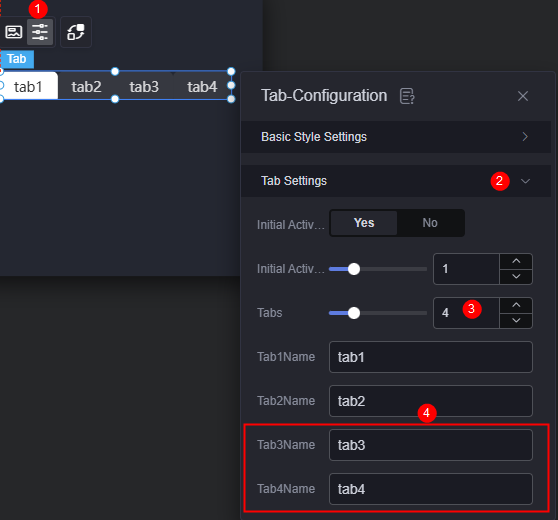
- Increase the number of tabs and set the tab name.
- Select the tab widget and click
 above the widget.
 - Set the number of tabs to 4 in the configuration.
Figure 3 Increasing the number of tabs
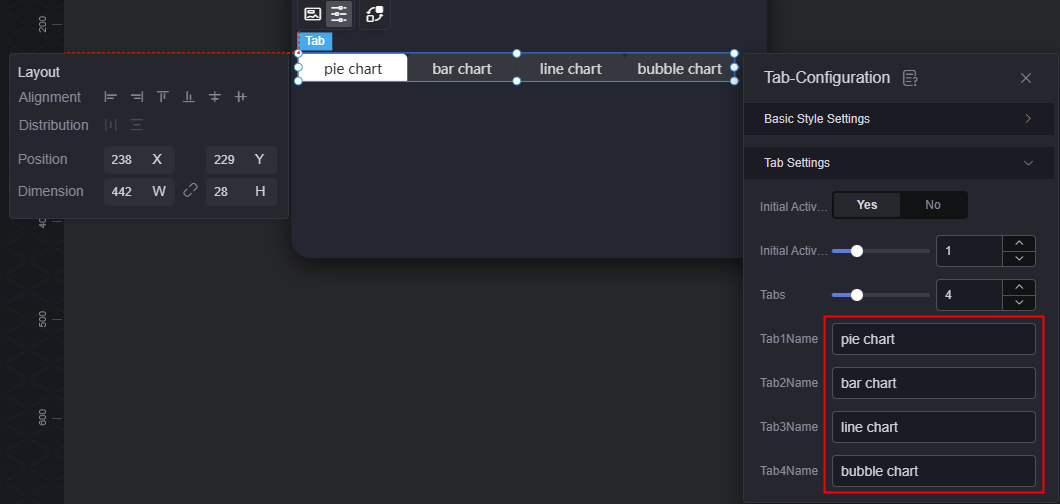
- Change the name of a tab.
Figure 4 Changing the tab name
- Adjust the relative positions of the rectangle decoration and tab widgets.
- Select the tab widget and click
- Drag and drop the basic pie chart, rose pie chart, basic bar chart, multi-line chart, and bubble chart widgets into the rectangle decoration widget.
Figure 5 Dragging a chart widget to the rectangle decoration widget
- Set the basic interaction based on different categories, that is, display or hide the widgets.
- Select the tab widget and click
 above the widget. The interaction setting page is displayed.
 - On the As Trigger area, click + Interaction Event and select the pie event.
- The pie event corresponds to the pie chart tab. When the pie chart is selected, two pie chart widgets are displayed and other chart widgets are hidden.
Figure 6 Displaying the pie chart widgets
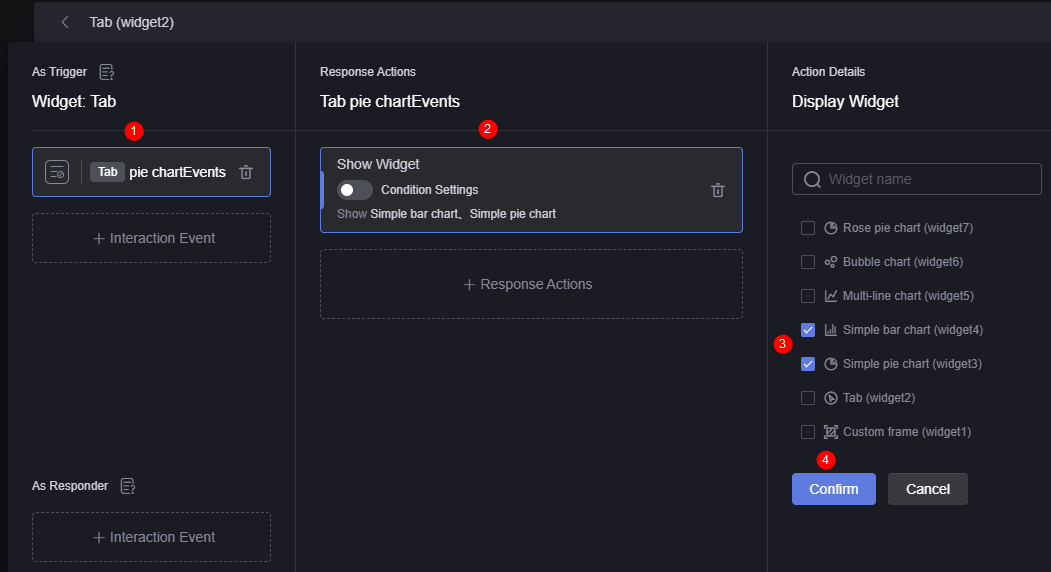 Figure 7 Hiding other chart widgets
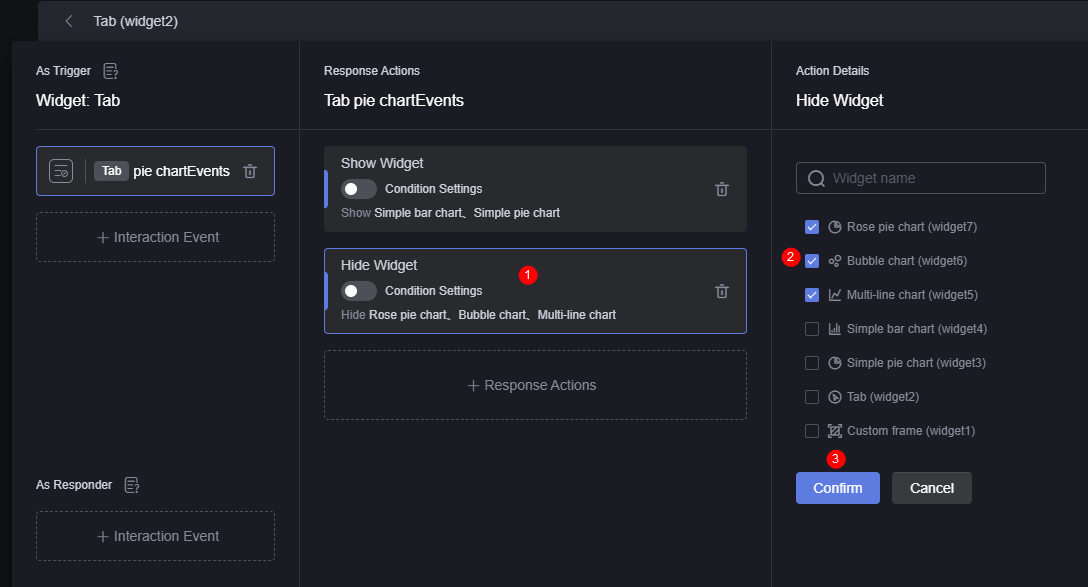
- Repeat the preceding operations to set the interaction actions corresponding to the bar chart event, line chart event, and bubble chart event tab pages.
Figure 8 Bar chart event interaction settings
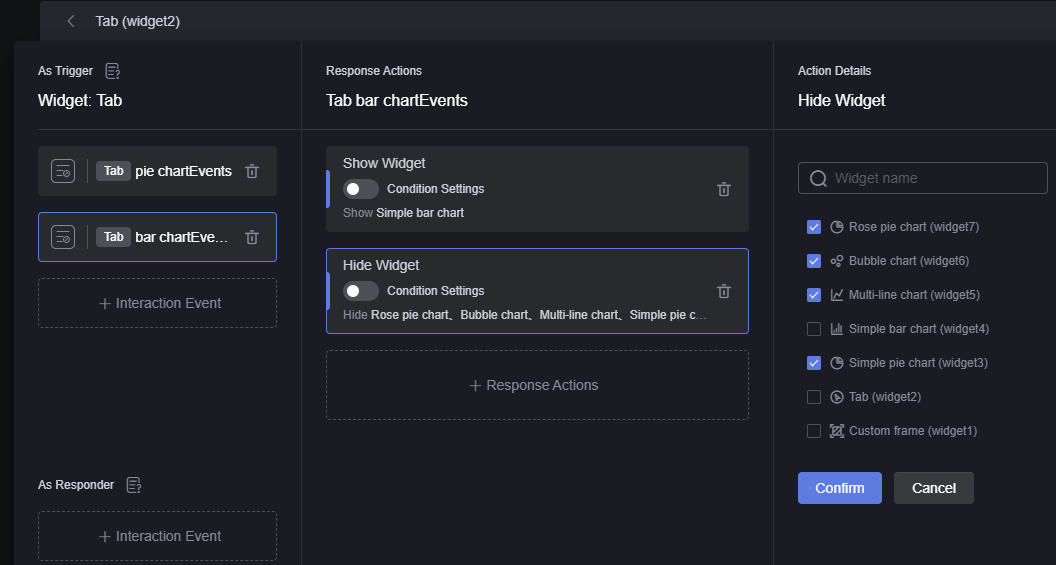 Figure 9 Line chart event interaction settings
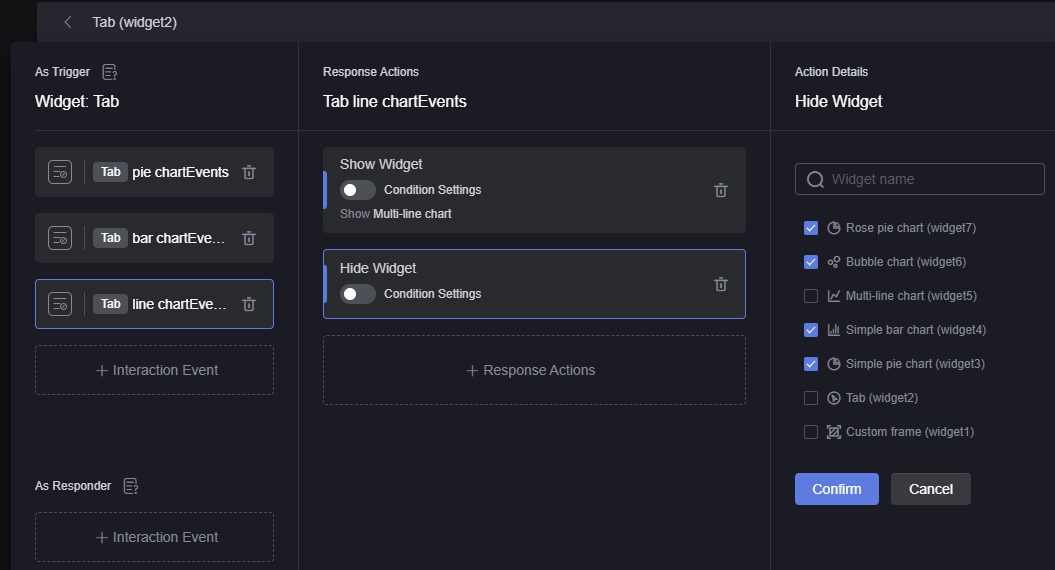 Figure 10 Bubble chart event interaction settings
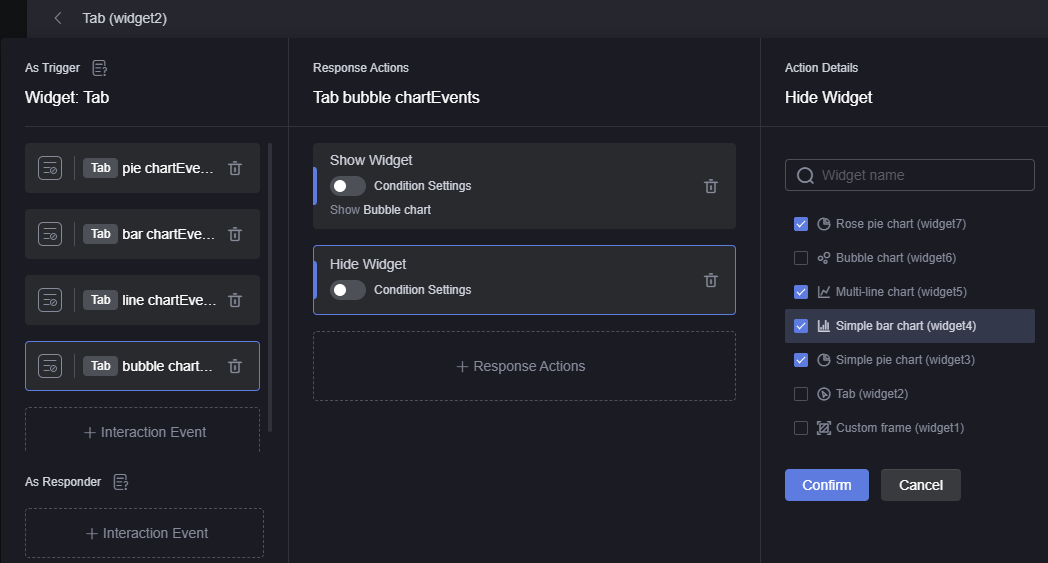
- After the setting is complete, click the finish button to return to the development page.
- Select the tab widget and click
- Click
 to save the page and click
  to preview the effect.
Parent topic: Interaction Configuration
Feedback
Was this page helpful?
Provide feedbackThank you very much for your feedback. We will continue working to improve the documentation.See the reply and handling status in My Cloud VOC.
The system is busy. Please try again later.
For any further questions, feel free to contact us through the chatbot.
Chatbot


