Help Center/
Application Operations Management/
User Guide/
Intelligent Insights (Beta)/
Checking Root Cause Analysis Results on AOM
Updated on 2025-09-03 GMT+08:00
Checking Root Cause Analysis Results on AOM
Intelligent Insights allow you to quickly locate and analyze the root causes of abnormal events. Based on historical service data of event inspection, drill-down analysis is performed based on service metrics and trace data for root cause locating.
Procedure
- Log in to the AOM 2.0 console.
- In the navigation pane, choose Application Monitoring > Intelligent Insights (Beta).
- Set a time range in the upper right corner of the page. You can use a predefined time label, such as Last hour and Last 6 hours, or customize a time range.
- Select a target application from the drop-down list above the filter.
- Click an event card or list to go to the event details page and view the root cause analysis result. (You can click the root cause component name under Root Cause Analysis on the event details page to go to the component details page. Currently, redirection is supported only in AP-Singapore.)
- Service Avg. RT Sharply Increases: Based on application trace data, AOM provides drill-down analysis by application, analyzes the average latency of each component, and locates the component that causes the RT to sharply increase.
Figure 1 Service avg. RT sharply increases

- Service Error Rate Sharply Increases: Based on application trace data, AOM provides drill-down analysis by application, analyzes the error rate of each component, and locates the component that causes the error rate to sharply increase. Click View Trace to trace the cause of the sharp increase in the error rate.
Figure 2 Service error rate sharply increases

- Top N API Avg. RT Sharply Increases: Based on application trace data, AOM provides RT analysis for APIs to quickly locate root causes.
Figure 3 Top N API avg. RT sharply increases

- Top N API Error Rate Sharply Increases: Based on application trace data, AOM provides error rate analysis for APIs to quickly locate root causes. Click View Trace to trace the cause of the sharp increase in the error rate.
Figure 4 Top N API error rate sharply increases

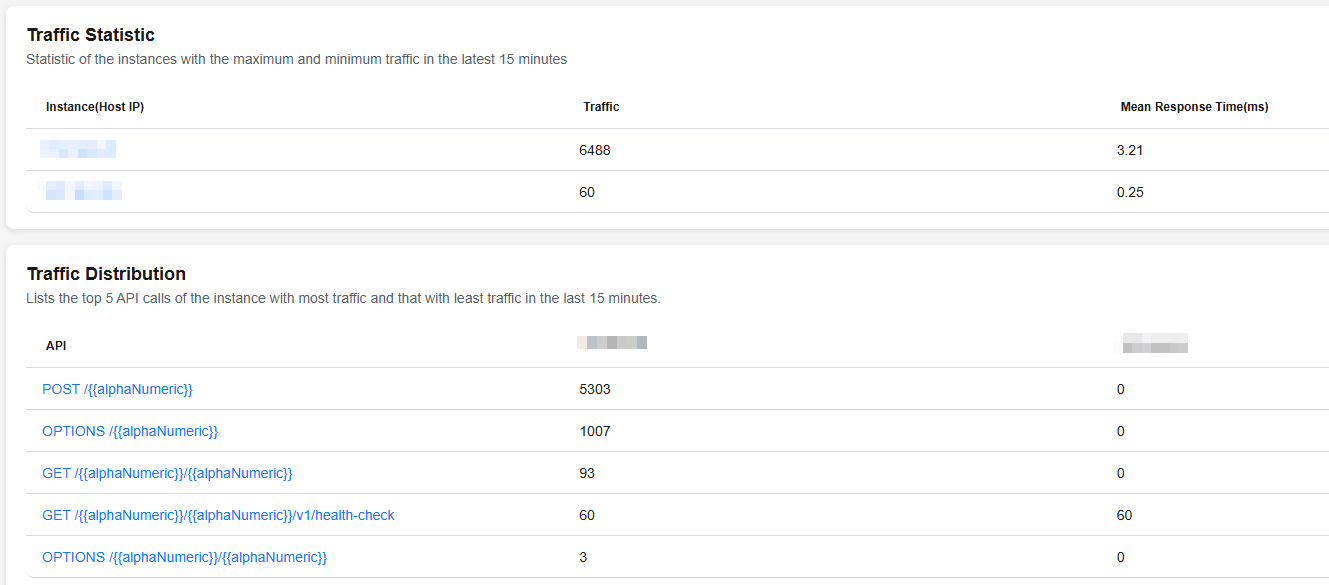
- Service Traffic Unbalanced: Based on the traffic data of all instances of an application, AOM displays the instances with the maximum and minimum traffic and their latency. It also shows the distribution of the top 5 APIs with the highest traffic on the instances with the maximum and minimum traffic, helping you quickly locate affected APIs. You can click an API to trace its recent calls.
Figure 5 Service traffic unbalanced

- Service Avg. RT Sharply Increases: Based on application trace data, AOM provides drill-down analysis by application, analyzes the average latency of each component, and locates the component that causes the RT to sharply increase.
Event Root Cause Analysis Methods
The intelligent insights function locates root causes based on trace drill-down. It consists of offline training and online inference.
- Offline training: After you enable the intelligent insights function, the offline training task of the root cause analysis model will be automatically enabled in the backend. The system then obtains the trace data generated during application API calling and trains the trace model based on the trace data of the last seven days. By default, the model is automatically updated in the backend every 14 days and saved in the backend database.
- Online inference: After you click an event card to go to the root cause analysis page, the online inference task of the root cause analysis model will be triggered. The system then compares the trace model previously trained offline with the calls of the abnormal event, and analyzes root causes for fast fault locating.
Feedback
Was this page helpful?
Provide feedbackThank you very much for your feedback. We will continue working to improve the documentation.See the reply and handling status in My Cloud VOC.
The system is busy. Please try again later.
For any further questions, feel free to contact us through the chatbot.
Chatbot


