

Help Center/ Application Operations Management/ User Guide/ Intelligent Patrol/ Checking the Fault Propagation Chain on AOM
Updated on 2026-09-18 GMT+08:00
Checking the Fault Propagation Chain on AOM
AOM provides the propagation chain of abnormal calls based on key metrics (such as the trace, average RT, and error rate), and displays key metric data of services and their associated services, helping you locate root causes more effectively.
Procedure
- Log in to the AOM 2.0 console.
- In the navigation pane, choose . The Intelligent Patrol page is displayed.
- Click an event card or list to go to the event details page and check the fault propagation chain.
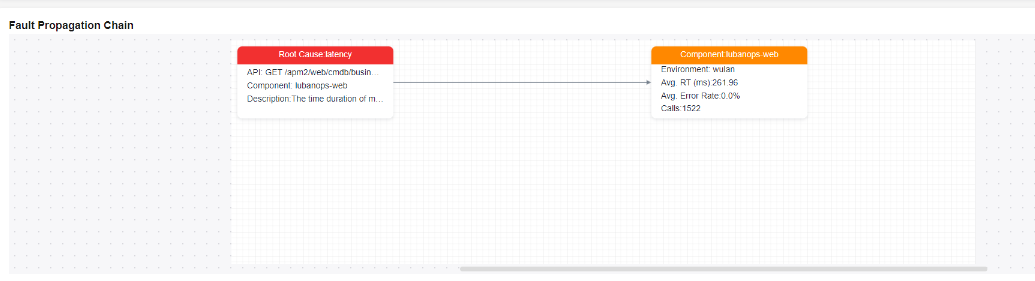
The fault propagation chain displays the faults in traces. You can locate root causes based on this chain. The fault propagation chain function is supported for the following types of abnormal events:
- Service Avg. RT Sharply Increases
- Top N API Avg. RT Sharply Increases
- Service Error Rate Sharply Increases
- Top N API Error Rate Sharply Increases
Figure 1 Fault propagation graph
What is your overall rating for this page?
0
1
2
3
4
5
6
7
8
9
10
Very dissatisfiedVery satisfied
Thank you very much for your feedback. We will continue working to improve the documentation.See the reply and handling status in My Cloud VOC.
The system is busy. Please try again later.
For any further questions, feel free to contact us through the chatbot.
Chatbot


