
Ajuste de desempenho do RDS for MySQL – resolução de problemas de alto uso de memória
O uso de memória e a taxa de acertos do pool de buffers são duas métricas importantes para medir o uso geral de memória da instância de banco de dados. Se o uso da memória for excessivamente alto, haverá o risco de esgotamento da memória. Se a taxa de acertos do pool de buffers for baixa, um grande número de páginas de dados solicitadas não poderá ser atingido no pool de buffers. Como resultado, o RDS precisa ler dados de discos. Isso aumenta as operações de I/O e as latências de consulta.
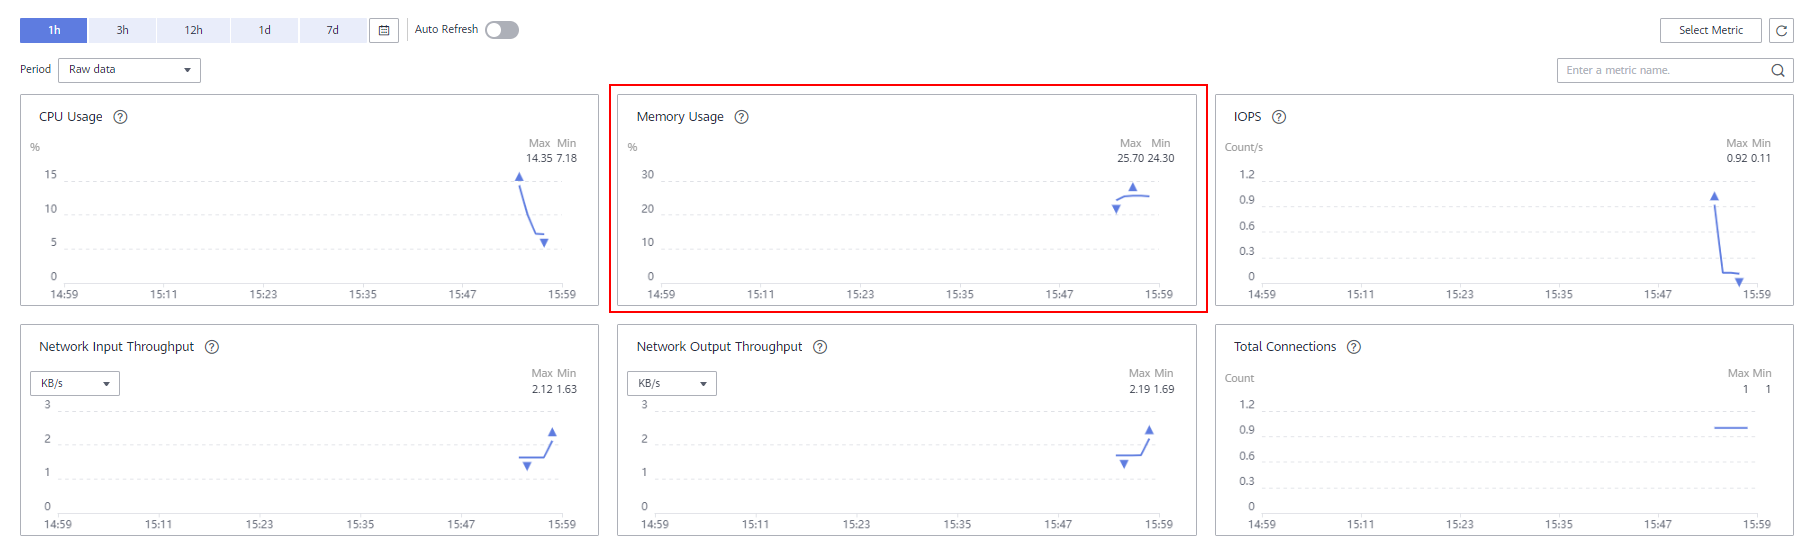
Visualizar o uso da memória
- Exiba o uso de memória de instâncias usando o Assistente de DBA. Para obter detalhes, consulte Métricas de desempenho.
- Você também pode usar performance_schema para configurar instrumentos de memória. Isso permite que você agregue estatísticas de uso de memória em tabelas de resumo de memória. Para obter mais informações, consulte Documentação oficial do MySQL.

O MySQL 5.6 não suporta performance_schema para monitoramento de uso de memória.
- Defina performance_schema como ON consultando Modificação dos parâmetros da instância do RDS for MySQL.
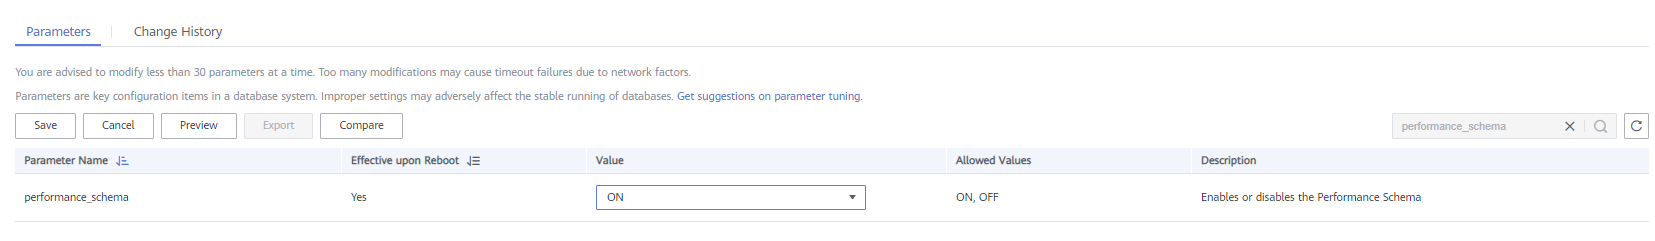
- Reinicialize sua instância de BD para que a modificação entre em vigor.
- Consulte a visão sys.memory_global_total para obter o uso total de memória.
- Consulte a visão sys.session.
- Verifique o campo current_memory quanto ao uso de memória de cada sessão.
select thd_id,conn_id, current_memory from sys.session;
- Verifique os detalhes de uso de memória do thread de sessão com alto uso de memória em performance_schema.
select * from memory_summary_by_thread_by_event_name where thread_id= "ID of the thread with high memory usage" order by CURRENT_NUMBER_OF_BYTES_USED;
- Verifique o campo current_memory quanto ao uso de memória de cada sessão.
- Consulte a visão sys.memory_by_thread_by_current_bytes.
- Verifique o campo current_allocated quanto ao uso de memória de cada thread em segundo plano.
select thread_id, user, current_allocated from memory_by_thread_by_current_bytes;
- Verifique os detalhes de uso de memória do thread em segundo plano com alto uso de memória em performance_schema.
select * from memory_summary_by_thread_by_event_name where thread_id= "ID of the thread with high memory usage" order by CURRENT_NUMBER_OF_BYTES_USED;
- Verifique o campo current_allocated quanto ao uso de memória de cada thread em segundo plano.
- Consulte a visão memory_global_by_current_bytes para estatísticas de uso de memória por tipo de alocação.
select event_name,current_alloc from sys.memory_global_by_current_bytes where event_name not like 'memory/performance_schema%' ;
- Analise a causa do alto uso de memória com base nos resultados da consulta.
Causas comuns do uso de memória excessivamente alto
Geralmente, o pool de buffers do InnoDB consome mais memória. A memória máxima que pode ser consumida por um pool de buffer depende das configurações de parâmetros do pool. Além disso, a maior parte da memória é alocada dinamicamente e, em seguida, ajustada à medida que as solicitações são processadas. O uso da memória inclui a memória usada por tabelas temporárias na memória, caches de pré-busca, caches de tabela, índices de hash e objetos de bloqueio de linha. Para obter mais informações sobre o uso de memória e os limites de parâmetros, consulte a documentação oficial do MySQL.
- Várias instruções em uma consulta
Você pode incluir várias instruções SQL em uma única consulta e separá-las usando ponto e vírgula (;). Ao receber a consulta multi-instrumentos, o RDS for MySQL processa as instruções SQL uma a uma. No entanto, alguma memória pode ser liberada somente depois que todas essas instruções SQL forem executadas.
Se muitas instruções SQL forem enviadas em um único lote, a memória usada por vários objetos para executar em lote essas instruções SQL aumenta em até algumas centenas de MB. Isso pode esgotar a memória disponível para o processo do MySQL.
Uma consulta de várias instruções causa um aumento acentuado do tráfego de rede. Você pode detectar um aumento repentino por meio do monitoramento de tráfego de rede ou do SQL Explorer. Portanto, consultas de várias instruções não são recomendadas.
- Problemas de pool de buffer
As páginas de dados de todas as tabelas são armazenadas no pool de buffers. Se as páginas de dados solicitadas forem atingidas no pool de buffer, o RDS não executará operações físicas de I/O. Nesse caso, o RDS executa instruções SQL muito rapidamente. Além disso, o pool de buffers usa o algoritmo de cache LRU menos usado recentemente para gerenciar as páginas de dados. Esse algoritmo permite que o pool de buffers armazene todas as páginas sujas na lista de descarga.
O pool de buffer do InnoDB é responsável pela maior proporção da memória fornecida pela sua instância de BD.
Os seguintes problemas estão relacionados ao pool de buffer:
- Se as páginas de dados não estiverem suficientemente pré-aquecidas, a latência da consulta aumenta. Isso pode ser um problema se você reiniciar sua instância de BD, ler dados frios ou se houver uma baixa taxa de acertos do pool de buffer. Antes de atualizar as especificações da instância ou iniciar uma promoção de vendas, recomendamos pré-aquecer suficientemente as páginas de dados.
- Pode haver muitas páginas sujas. Se uma página suja não for atualizada por um longo período de tempo, por exemplo, se a diferença entre os números de sequência de log (LSNs) mais antigos e atuais da página suja exceder 76%, um thread de usuário será acionado para atualizar a página de forma síncrona. Isso diminui significativamente o desempenho da sua instância de banco de dados. Para corrigir esse problema, você pode equilibrar as cargas de gravação, evitar taxa de transferência excessivamente alta para operações de gravação, reconfigurar os parâmetros que especificam como atualizar páginas sujas ou atualizar especificações de instância.
- Problemas de tabela temporária
O tamanho da tabela temporária na memória é limitado pelos parâmetros tmp_table_size e max_heap_table_size. Se o tamanho de uma tabela temporária na memória exceder o limite configurado, a tabela temporária na memória será convertida em uma tabela temporária no disco. Se muitas tabelas temporárias forem criadas em várias conexões, o uso de memória da instância de banco de dados aumentará repentinamente. O MySQL 8.0 fornece um novo mecanismo TempTable. Com esse mecanismo, o tamanho total das tabelas temporárias na memória criadas por todos os threads deve ser menor que o valor de temptable_max_ram. O valor padrão desse parâmetro é 1 GB. Se o tamanho total exceder o valor desse parâmetro, as tabelas temporárias anteriores na memória serão convertidas em tabelas temporárias no disco.
- Outras questões
Se muitas tabelas forem criadas na sua instância de BD ou se o QPS for alto, o cache da tabela poderá consumir uma certa quantidade de memória. Recomendamos que você não crie muitas tabelas ou defina table_open_cache para um valor muito grande.
O uso de memória padrão para índices de hash adaptativos é 1/64 do tamanho do pool de buffer. Se você consultar ou gravar campos grandes do tipo de dados BLOB, a memória será alocada dinamicamente para esses campos grandes. Isso também aumenta o uso de memória da instância de BD.
Se o uso de memória aumentar anormalmente ou a memória se esgotar completamente, você poderá localizar a causa consultando a documentação oficial do MySQL.


