

Viewing the Overall Status of a DB Instance
On the Summary page, you can get knowledge of the overall status of your RDS for PostgreSQL instance, including alarms, intelligent anomaly diagnosis, and key performance metrics. DBA Assistant diagnoses instance health using operational data analytics and intelligent algorithms, and provides you with solutions and suggestions for handling detected exceptions.
Functions
Table 1 lists the functions provided on the Summary page.
| Function | Description |
|---|---|
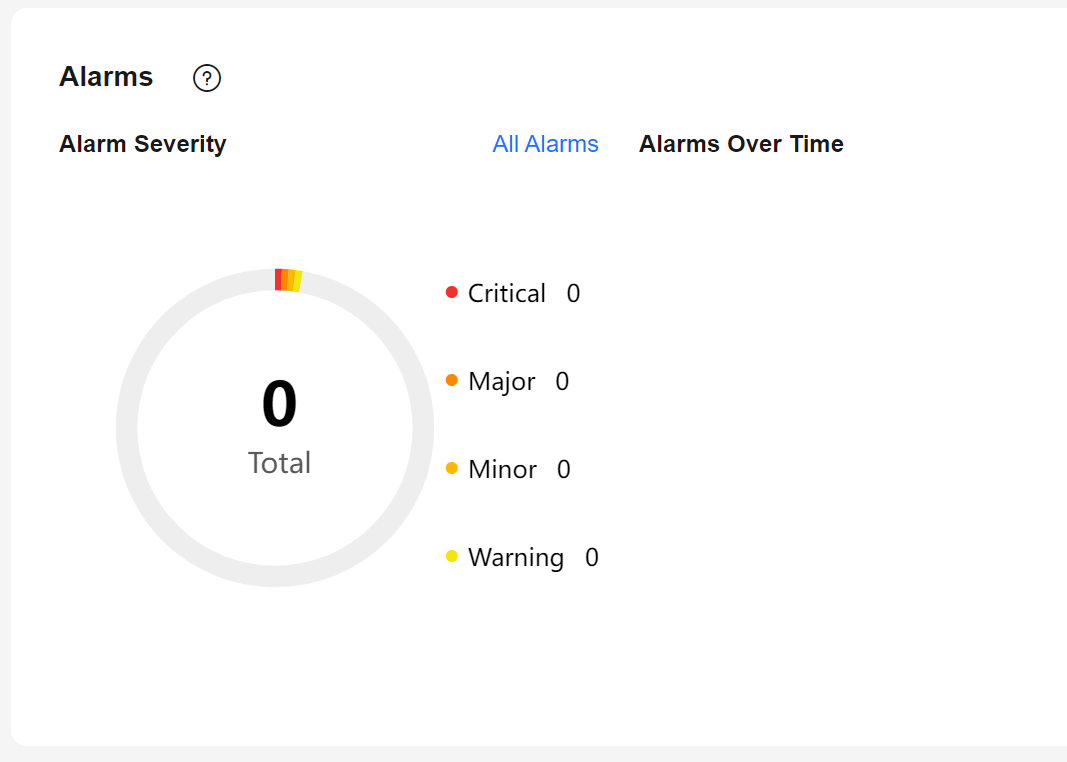
| Alarms | To view alarm details, click the number next to an alarm severity. |
| Intelligent Anomaly Diagnosis | Shows the health status of your instance based on operational data analytics and intelligent algorithms. |
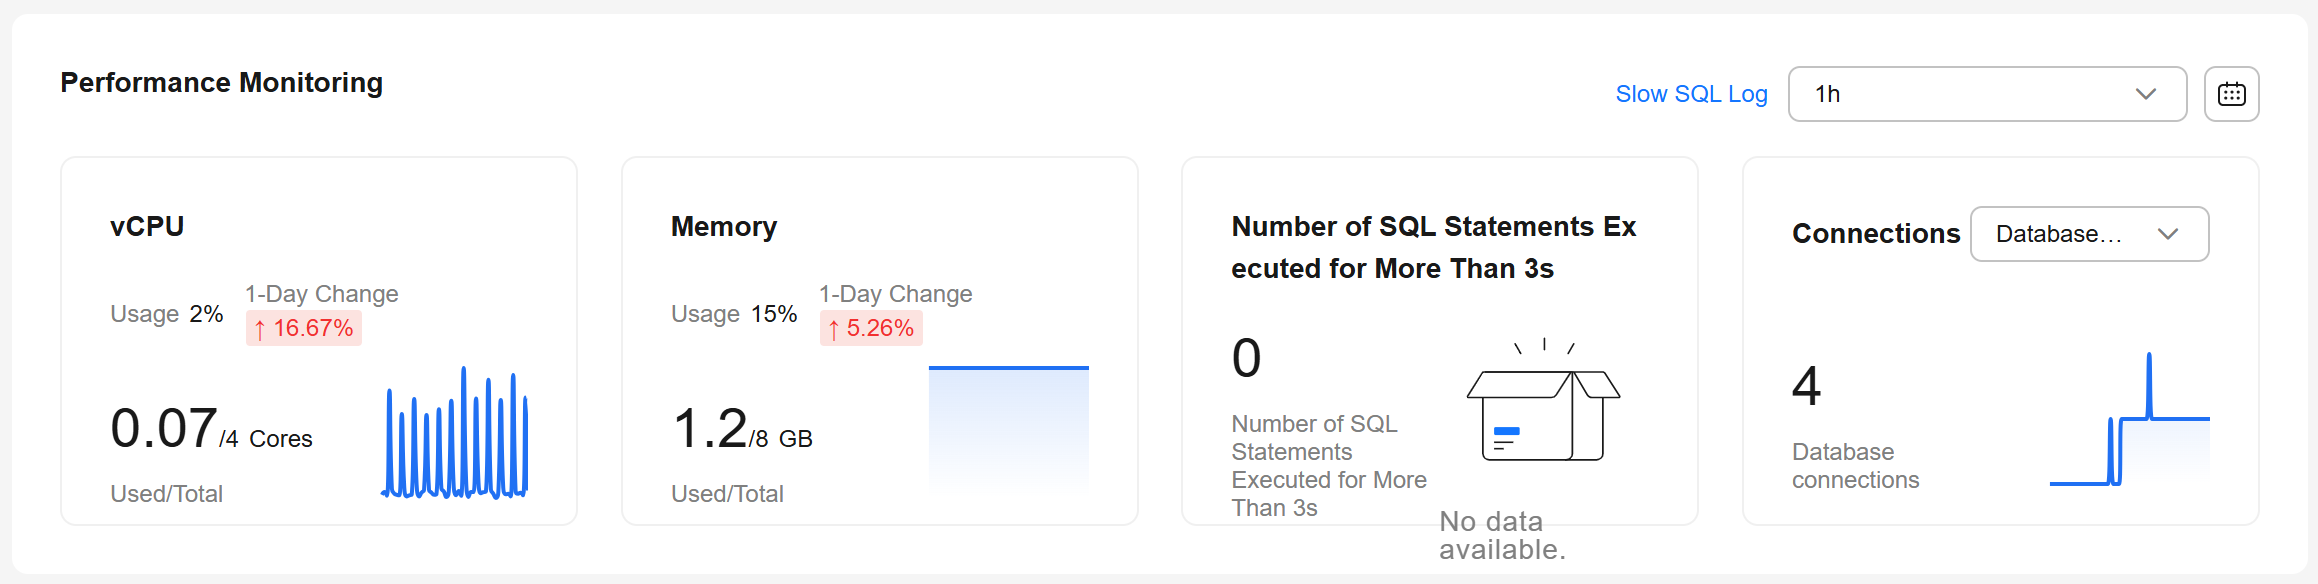
| Performance Monitoring | Shows key performance metrics of the instance, including the CPU usage, memory usage, number of SQL statements executed for more than 3s, and connections. |
Alarms
- Log in to the RDS console.
- Click
 in the upper left corner and select a region.
 - On the Instances page, click the DB instance name.
- On the Summary page, view the status of your instance.
- In the Alarms area, view alarm information of your instance.
To view the list of all alarms, click All Alarms. To view alarm details, click the number next to an alarm severity.
Figure 1 Alarms
- In the Intelligent Anomaly Diagnosis area, view the health diagnosis results of your instance.

Intelligent Anomaly Diagnosis provides diagnosis results for the check items in the past 5 minutes. If any diagnosis result is abnormal, the check item is abnormal in the past 5 minutes.
Figure 2 Intelligent Anomaly Diagnosis

- In the Performance Monitoring area, view key performance metrics of your instance. Figure 3 Performance Monitoring
- In the Alarms area, view alarm information of your instance.
What is your overall rating for this page?
Thank you very much for your feedback. We will continue working to improve the documentation.See the reply and handling status in My Cloud VOC.
For any further questions, feel free to contact us through the chatbot.
Chatbot


