

Viewing MRS Cluster Events
During routine O&M of MRS clusters, administrators must monitor cluster status changes promptly to prevent and troubleshoot potential issues. Cluster events serve as audit trails for operational records and status changes that occur during system runtime, such as component instance startups, stops, active/standby switchovers, and node slow disk isolation changes. Unlike alarms, events do not necessarily indicate system exceptions. However, for events with a severity level of Major or higher, check whether the associated components are operating correctly. Viewing cluster events helps administrators monitor cluster health, detect potential risks early, and take preventive measures.
For details about common events in an MRS cluster, see Table 2.
Generally, you do not need to manually handle events. However, for events of the major or higher severity, you need to check whether the related components are running properly and whether related alarms exist. For details, see Viewing Alarms of an MRS Cluster.
Concepts
- Differences between events and alarms: Events are records of status changes and operational actions that occur during system runtime, used primarily for auditing and tracking system behavior. In contrast, alarms are notifications triggered when the system detects exceptions, requiring direct administrator handling. While events generally do not require manual intervention, check whether associated alarms are generated for events with a severity level of Major or higher.
- IAM user synchronization: When performing operations on the MRS console, synchronize user information from IAM to the cluster to ensure consistent user permissions. Before viewing cluster events on the management console, ensure that IAM users have been synchronized.
Video Tutorial
This tutorial introduces how to view cluster alarms and events and configure an alarm threshold.
The UI may vary depending on the version. This tutorial is for reference only.
Viewing Cluster Events on the Management Console
- Log in to the MRS console.
- On the Active Clusters page, select a running target cluster and click its name to go to the cluster details page.
- On the Dashboard page, click Synchronize next to IAM User Sync to synchronize IAM users.
IAM user synchronization synchronizes user information from IAM to the cluster, ensuring consistent operational permissions on the console.
- Choose Alarms > Events. On the displayed page, view event information about the cluster. Figure 1 Viewing MRS cluster events
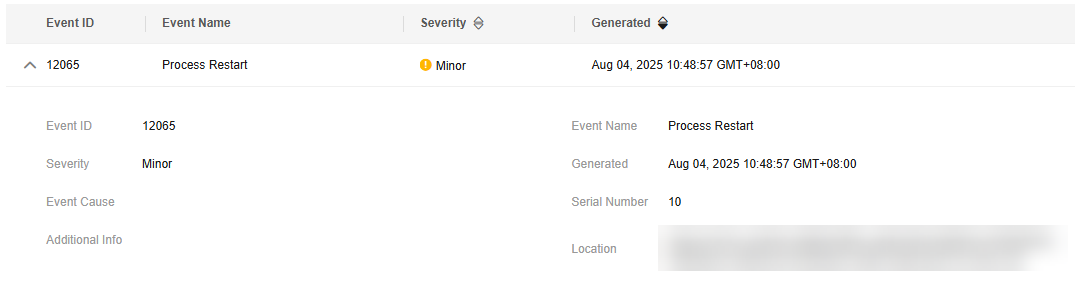
In the event list, you can check events generated in the current cluster, including the event name, severity, and generation time.
You can click the arrow before an event name to expand the event details.
- To export event information, click Export, select the file format, and export the event file to a local directory.
On the Events page, verify that the event list loads properly and event information is displayed correctly. Verify that the event severity and generation time are accurate. Click the arrow next to an event name to expand event details, and confirm that the details are complete and readable.
Viewing Cluster Events on Manager
- Log in to FusionInsight Manager of the MRS cluster.
For details about how to log in to FusionInsight Manager, see Accessing MRS Manager.
- Choose . On the displayed Events page, you can view information about all events in the cluster, including the event name, ID, severity, generation time, source, object, and location. By default, the latest 10 events are displayed on each page.
- For clusters of MRS 2.x or earlier, choose Alarms > Events.
- Click Export All to export all event details.
- You can click
 to manually refresh the current page and click
  to select the columns that will display.
 - You can filter events by object or cluster.
- You can click Advanced Search to search for events by event ID, name, severity, start time, or end time.
You can click
 on the left of an event to view detailed event parameters. Table 1 describes the parameters.
Table 1 Event parameters Parameter
Description
Event ID
Event ID.
Event Name
Event name.
Event Severity
Event severity. The options are Critical, Major, Minor, and Suggestion.
- Critical: A critical fault has occurred. The system requires immediate rectification.
- Major: A major system issue has occurred. Handle and resolve the problem as soon as possible.
- Minor: A minor system issue has occurred. It requires administrator attention.
- Suggestion: An event has occurred. Used for informational purposes only; no action is required.
Generated
The date and time when the event was generated, formatted as yyyy-MM-dd HH:mm:ss.
Object
Information about the object associated with the event, such as the service name and role name.
Serial Number
The unique numerical identifier for an event generated by the system.
Location
Detailed information for locating the event, which includes the following:
- Source: cluster for which the event is generated.
- ServiceName: service for which the event is generated.
- RoleName: role for which the event is generated.
- HostName: host for which the event is generated.
Additional Info
Supplemental error details for the event, used for troubleshooting and fault localization.
Event Cause
The potential root cause of the event, helping administrators understand why the event occurred.
Source
The name of the cluster where the event was generated.
Common Events of an MRS Cluster
| Event ID | Component | Event Name | Event Severity |
|---|---|---|---|
| 12019 | Manager | Stop Service | Warning |
| 12021 | Manager | Stop RoleInstance | Warning |
| 12023 | Manager | Delete Node | Warning |
| 12024 | Manager | Restart Service | Warning |
| 12025 | Manager | Restart RoleInstance | Warning |
| 12026 | Manager | Manager Switchover | Minor |
| 12065 | Manager | Restart Process | Minor |
| 12070 | Manager | Job Running Succeeded | Warning |
| 12071 | Manager | Job Running Failed | Warning |
| 12072 | Manager | Job Killed | Warning |
| 12082 | Manager | Automatic Disk Isolation Stopped | Major |
| 12083 | Manager | Slow Disk Isolated | Major |
| 12084 | Manager | Disk Data Balancing Failed | Major |
| 12085 | Manager | Disk Recovered | Major |
| 12086 | Manager | Restart Agent | Warning |
| 12087 | Manager | Cancel Disk Isolation Failed | Major |
| 12088 | Manager | Disk Isolation Cancelled | Major |
| 12089 | Manager | Disk Isolation Failed | Major |
| 12090 | Manager | Disk Node Isolated | Major |
| 12091 | Manager | Disk Node Isolation Cancelled | Major |
| 12092 | Manager | Disk Node Instance Started | Major |
| 12093 | Manager | Disk Node Isolation Failed | Major |
| 12094 | Manager | Disk Node Instance Start Failed | Major |
| 12095 | Manager | Cancel Disk Node Isolation Failed | Major |
| 12096 | Manager | Disk Node Recovered | Major |
| 12097 | Manager | Abnormal Connection to OMS Node Network | Major |
| 12152 | Manager | Start Periodic Replication | Minor |
| 12153 | Manager | Periodic Replication Completed | Minor |
| 12154 | Manager | Start Streaming Replication | Minor |
| 12155 | Manager | Restart Streaming Replication | Minor |
| 12156 | Manager | Stop Streaming Replication | Minor |
| 12157 | Manager | Skip Periodic Synchronization | Minor |
| 12158 | Manager | Host Information Lost | Minor |
| 14005 | HDFS | NameNode Switchover | Minor |
| 14028 | HDFS | HDFS Disk Balance | Minor |
| 14029 | HDFS | Active NameNode In Safe Mode and New FSimage Generated | Minor |
| 17001 | Oozie | Oozie Workflow Execution Failed | Major |
| 17002 | Oozie | Oozie Scheduled Job Execution Failed | Major |
| 18001 | Yarn | ResourceManager Switchover | Minor |
| 18004 | Mapreduce | JobHistoryServer Switchover | Minor |
| 18029 | Yarn | Jobs Occupied Too Many Storage Resources | Minor |
| 19001 | HBase | HMaster Failover | Minor |
| 19027 | HBase | RegionServer-level Hotspot Transfer | Major |
| 19028 | HBase | Hotspot Region Splitting | Major |
| 19029 | HBase | Hotspot Region Isolation | Major |
| 20003 | Hue | Hue Failover | Minor |
| 23002 | Loader | Loader Failover | Major |
| 24002 | Flume | Flume Channel Overflow | Major |
| 25001 | LdapServer | LdapServer Failover | Minor |
| 27000 | DBService | DBServer Switchover | Minor |
| 38003 | Kafka | Topic Data Storage Period Changed | Warning |
| 43014 | Spark | Spark Data Skew | Warning |
| 43015 | Spark | Spark SQL Ultra-Large Query Results | Warning |
| 43016 | Spark | Spark SQL Timeout | Warning |
| 43024 | Spark | Start JDBCServer | Warning |
| 43025 | Spark | Stop JDBCServer | Warning |
| 43026 | Spark | ZooKeeper Connection Succeeded | Warning |
| 43027 | Spark | Zookeeper Connection Failed | Warning |
| 43601 | GraphBase | GraphBase Failover | Minor |
| 45002 | HetuEngine | QAS Failover | Minor |
| 45597 | IoTDB | Region Replica Supplementation | Warning |
| 45651 | Flink | FlinkServer Failover | Minor |
Helpful Links
- You can configure event notifications to receive notification messages through different subscription endpoints (such as SMS messages and emails). For details, see Configuring Notifications for MRS Cluster Alarms and Events.
- You can view MRS operation logs on the management console. For details, see Viewing MRS Operation Logs.
- For details about viewing and handling alarms generated in a cluster, see Viewing Alarms of an MRS Cluster.
- For details about configuring alarm thresholds for cluster monitoring metrics, see Configuring Alarm Thresholds for an MRS Cluster.
What is your overall rating for this page?
Thank you very much for your feedback. We will continue working to improve the documentation.See the reply and handling status in My Cloud VOC.
For any further questions, feel free to contact us through the chatbot.
Chatbot


