Viewing MRS Cluster Component Monitoring Metrics
You can manage the following status and metrics of all components (including role instances) on the MRS console: Status information includes operation, health, configuration, and role instance status. Indicator information includes key monitoring indicators for each component.
Viewing the Monitoring Information on the MRS Management Console
- Log in to the MRS console.
- Choose Active Clusters and click a cluster name to go to the cluster details page.
- On the Dashboard tab, click Synchronize next to IAM User Sync to synchronize IAM users.
- On the MRS cluster details page, click Components.
- View component monitoring information.
- Click a specified service in the list to view its status and metric information.
- Select and view component-level monitoring metrics.
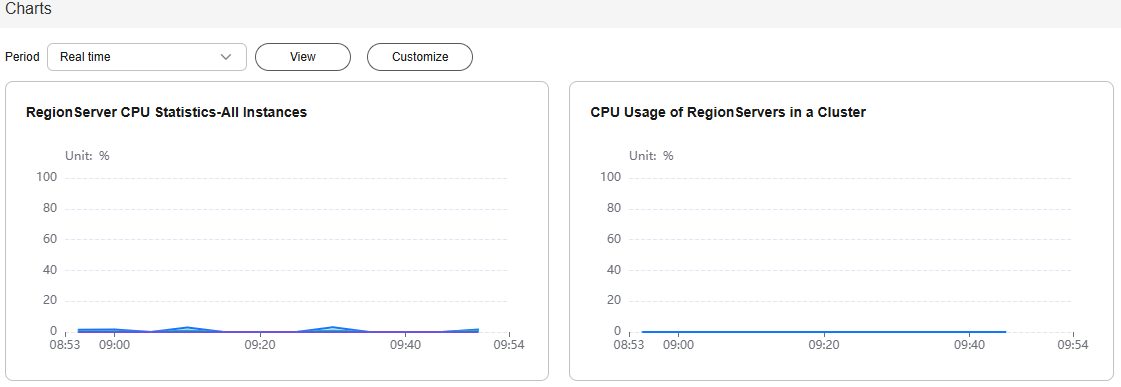
- In the Charts area, click Customize to customize service monitoring metrics.
- In Period area, select a time of period and click View to view the monitoring data within the time period.
Figure 1 Selecting and viewing component monitoring metrics
- View role instance monitoring information.
- In the component list, click a service name.
- Click Instance to view the status of each role instance in the component.
You can filter all instances of the same role in the upper right corner of the list. You can set search criteria in the role search area by clicking Advanced Search, and click Search to view specified role information. You can click Reset to reset the search criteria. Fuzzy search is supported.
- Click the target role instance to view its status and metric information.
- Customize and view monitoring graphs.
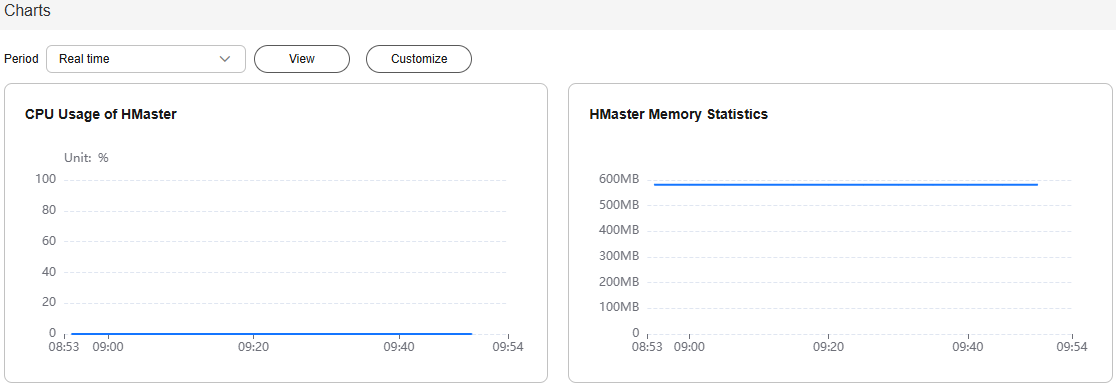
- In the Charts area, click Customize to customize service monitoring metrics.
- In Period area, select a time of period and click View to view the monitoring data within the time period.
Figure 2 Selecting and viewing instance monitoring charts
Viewing Component Monitoring Information on Manager
- Log in to FusionInsight Manager of the MRS cluster.
For details about how to log in to FusionInsight Manager, see Accessing MRS Manager.
- Go to the Service Management page.
- For MRS 3.x and later, choose Cluster > Services.
- For MRS 2.x and earlier, click Services.
- View component monitoring information.
- Click a specified service in the list to view its status and metrics.
- Customize and export monitoring charts.
- In the Chart tab, click
 and Customize to customize service monitoring metrics.
 - Set a time range and click
 and Export to export the monitoring data.
 - Click the help button next to a metric name to view the detailed help information about the metric.
Figure 3 Selecting and exporting component monitoring charts
- In the Chart tab, click
- View role instance monitoring information.
- Click the service name.
- Click Instances to view the role status.
- Click the target role instance to view its status and metric information.
- Customize and export monitoring charts.
- In the Chart tab, click
 and Customize to customize metric chart.
 - Select a time range. The monitoring data within the time range is displayed.
- Click the help button next to a metric name to view the detailed help information about the metric.
Figure 4 Selecting and exporting instance monitoring charts
- In the Chart tab, click
Component Resource Monitoring Summary

This function is supported only in MRS 3.x and later versions.
Log in to FusionInsight Manager and choose Cluster > Services > Target service. Click Resource. The resource monitoring page is displayed.
Some services in the cluster provide service-level resource monitoring metrics. By default, the monitoring data of the latest 12 hours is displayed. You can click  to set a time range. You can click
  to export the corresponding report information. If a monitoring item has no data, the report cannot be exported. The following table lists the services and monitoring items that support resource monitoring.
|
Service |
Monitoring Metric |
Description |
|---|---|---|
|
HDFS |
Resource Usage (by Tenant) |
|
|
Resource Usage (by User) |
|
|
|
Resource Usage (by Directory) |
|
|
|
Resource Usage (by Replica) |
|
|
|
Resource Usage (by File Size) |
|
|
|
Recycle Bin (by User) |
|
|
|
Operation Count |
|
|
|
Automatic Balancer |
Collects statistics on the execution speed of HDFS automatic balancer and the total capacity of the current balancer migration. |
|
|
NameNode RPC Open Connections (by User) |
Displays the number of connections of each user in the Client RPC requests connected to NameNodes. |
|
|
Slow DataNodes |
Displays DataNode that transmits or processes data slowly in the cluster. |
|
|
Slow Disks |
Displays the disk that processes data slowly on the DataNode in the cluster. |
|
|
HBase |
Operation Requests in Tables |
Displays the number of PUT, DELETE, GET, SCAN, INCREMENT, and APPEND operation requests in all tables on all RegionServers. |
|
Operation Requests on RegionServers |
Displays the number of PUT, DELETE, GET, SCAN, INCREMENT, and APPEND operation requests and number of all operation requests in RegionServer. |
|
|
Operation Requests for Service |
Displays the number of PUT, DELETE, GET, SCAN, INCREMENT, and APPEND operation requests in all regions on RegionServers. |
|
|
HFiles on RegionServers |
Displays the number of HFiles in all RegionServers. |
|
|
HetuEngine |
Coordinator Resource Usage |
Displays the coordinator resource usage in the selected queue. |
|
Coordinator Resource Usage Ratio |
Displays the coordinator resource usage in the selected queue. |
|
|
Worker Resource Usage |
Displays the worker resource usage in the selected queue. |
|
|
Worker Resource Usage Ratio |
Displays the worker resource usage in the selected queue. |
|
|
Number of Coordinators and Workers |
Displays the number of coordinators and workers in the selected queue. |
|
|
Hive |
HiveServer2-Background-Pool Threads (by IP) |
Displays the number of HiveServer2-Background-Pool threads of top users. These threads are measured and displayed in a measurement period. |
|
HiveServer2-Handler-Pool Threads (by IP) |
Displays the number of HiveServer2-Handler-Pools of top users collected and displayed in a period. |
|
|
Used MetaStore Number (by IP) |
Collects statistics on and displays the MetaStore usage of top users in a period. |
|
|
Number of Hive jobs |
Displays the number of user-related jobs collected by Hive in a period. |
|
|
Number of Files Accessed in the Split Phase |
Displays the number of files accessed by the underlying file storage system (HDFS by default) in the Split phase in a period. |
|
|
Hive Basic Operation Time |
Collects time for creating a directory (mkdirTime), creating a file (touchTime), writing a file (writeFileTime), renaming a file (renameTime), moving a file (moveTime), deleting a file (deleteFileTime), and deleting a directory (deleteCatalogTime) in a period of time. |
|
|
Table Partitions |
Displays the number of partitions in all Hive tables, which is displayed in the following format: database # table name, number of table partitions. |
|
|
HQL Map Count |
Collects statistics on HQL statements executed in a period and the number of Map statements invoked during the execution. The displayed information includes users, HQL statements, and the number of Map statements. |
|
|
HQL Access Statistics |
Displays the number of HQL access times in a period. |
|
|
Kafka |
Kafka Disk Usage Distribution |
Displays the disk usage distribution statistics of the Kafka cluster. |
|
Spark/Spark2x |
HQL Access Statistics |
Collects HQL access statistics in a period, including the username, HQL statement, and HQL statement execution times. |
|
Yarn |
Used resources (by Task) |
|
|
Resource Usage (by Tenant) |
|
|
|
Resource usage ratio (by Tenant) |
|
|
|
Task Duration Ranking |
Displays Yarn tasks sorted by time consumption. |
|
|
ResourceManager RPC Open Connections (by User) |
Displays the number of client RPC connections to ResourceManager by user. |
|
|
HBase Operation Count |
Collects statistics on the number and proportion of operations corresponding to each Yarn operation type. |
|
|
Ranking of Tasks in a Queue by Resource Usage |
|
|
|
Ranking of Users in a Queue by Resource Usage |
|
|
|
ZooKeeper |
Used Resources (By Second-Level Znode) |
|
|
Number of Connections (by Client IP Address) |
Displays the ZooKeeper client connection resource status. |
Feedback
Was this page helpful?
Provide feedbackThank you very much for your feedback. We will continue working to improve the documentation.See the reply and handling status in My Cloud VOC.
For any further questions, feel free to contact us through the chatbot.
Chatbot


