Viewing MRS Cluster Resource Monitoring Metrics
MRS cluster nodes are classified into management nodes, control nodes, and data nodes. The change trends of key host monitoring metrics on each type of node can be calculated and displayed as curve charts in reports based on the customized periods. MRS cluster metrics are monitored periodically. The average historical monitoring interval is about 5 minutes.
You can view the overall resource usage of a cluster on the MRS console or MRS Manager. The monitoring metrics of clusters, components, and nodes are supported. For details about how to view the metrics of components and nodes, see Viewing MRS Cluster Component Monitoring Metrics and Viewing MRS Node Resource Monitoring Metrics.
Viewing Monitoring Information on the MRS Management Console
- Log in to the MRS console.
- On the Active Clusters page, select a running cluster and click its name to switch to the cluster details page.
- On the Dashboard tab, click Synchronize next to IAM User Sync to synchronize IAM users.
- After the synchronization is complete, click the Monitor tab to view the monitoring metric report of the cluster.
- In time range area, specify a period to view monitoring data.
Figure 1 Selecting a time range for monitoring data

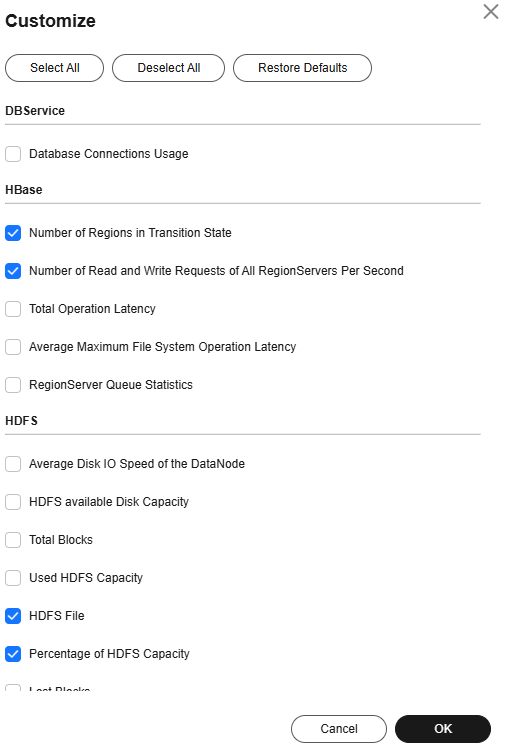
- Customize a monitoring report.
- Click Customize and select monitoring metrics to display.
- Click OK to save the selected monitoring metrics for display.
- Click Deselect All to deselect all metrics.
Figure 2 Customizing a monitoring metric report
- Export a monitoring report.
Monitoring metric reports can be exported only for versions earlier than MRS 3.x.
- Select a period.
- Click Export. MRS will generate a report about the selected monitoring metrics in a specified time range. Save the report.
Viewing Monitoring Information on Manager (MRS 3.x and Later)
- Log in to FusionInsight Manager of the MRS cluster.
For details about how to log in to FusionInsight Manager, see Accessing MRS Manager.
- Choose Homepage.
- In the upper right corner of the chart area, click
 and choose Customize from the displayed menu.

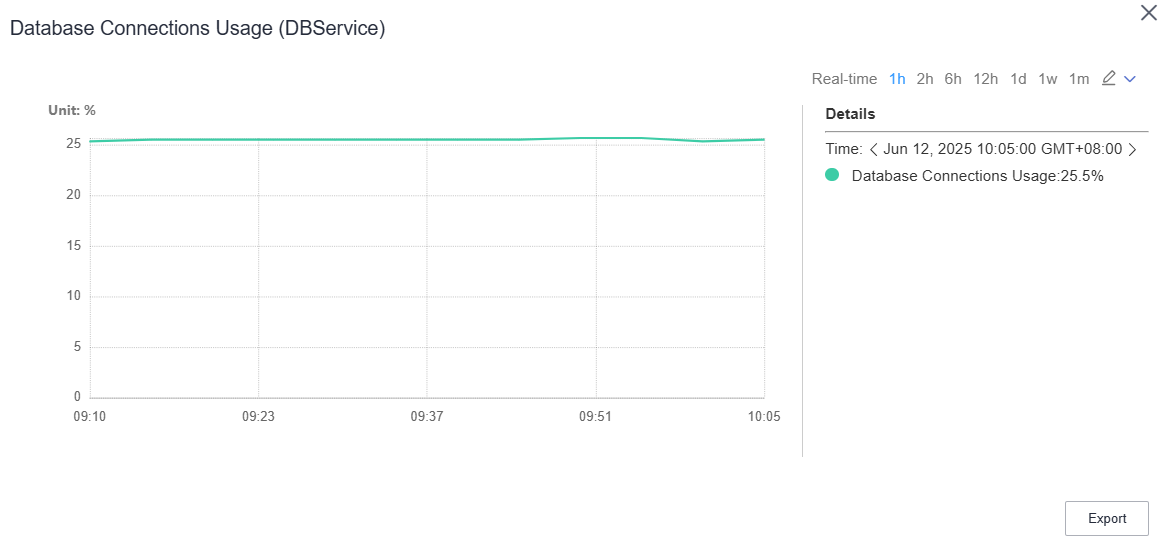
Monitoring data of the past 1 hour is displayed at an interval of 5 minutes. After you enter the Real-time Monitoring page, you can view that real-time monitoring data is displayed on the right of the monitoring chart at an interval of 5 minutes.
- In the navigation pane, select an entity and some monitoring metrics.
- Click OK to view the metric details.
- Export a monitoring report.
- Exporting all monitoring data
- On the Homepage, select a time range in the upper right corner of the chart area, for example, 1w.
Real-time data is displayed by default, which cannot be exported. You can click
 to customize a time range.
 - In the upper right corner of the chart area, click
 and choose Export from the displayed menu.
- On the Homepage, select a time range in the upper right corner of the chart area, for example, 1w.
- Exporting monitoring data of a specified monitoring item
- On the Homepage, click
 in the upper right corner of any monitoring report pane in the chart area of the target cluster.
 - Select a time range to obtain monitoring data, for example, 1w.
Real-time data is displayed by default, which cannot be exported. You can click
 to customize a time range.
 - Click Export.
Figure 3 Exporting monitoring data of a specified monitoring item

- On the Homepage, click
The interval on the horizontal axis of the chart varies depending on the time period you specify. Data monitoring rules are as follows:
- If the disk usage of the partition where GaussDB is deployed exceeds 80%, real-time monitoring data and monitoring data whose interval is 5 minutes will be deleted.
- Storage resources (HDFS) in Tenant Resources (0 to 300 hours): The interval is 1 hour. The cluster must have been installed for at least 1 hour, and monitoring data of a maximum of 3 months is saved.
- 0 to 25 hours: The interval is 5 minutes. The cluster must have been installed for at least 10 minutes, and monitoring data of a maximum of 15 days is saved.
- 25 to 150 hours: The interval is 30 minutes. The cluster must have been installed for at least 30 minutes, and monitoring data of a maximum of 3 months is saved.
- 150 to 300 hours: The interval is 1 hour. The cluster must have been installed for at least 1 hour, and monitoring data of a maximum of 3 months is saved.
- 300 hours to 300 days: The interval is 1 day. The cluster must have been installed for at least 1 day, and monitoring data of a maximum of 6 months is saved.
- Over 300 days: The interval is 7 days. The cluster must have been installed for more than 7 days, and monitoring data of a maximum of 1 year is saved.
- Exporting all monitoring data
Viewing Monitoring Information on Manager (MRS 2.x and Earlier)
- Log in to FusionInsight Manager of the MRS cluster.
For details about how to log in to FusionInsight Manager, see Accessing MRS Manager.
- Choose System on MRS Manager.
- In Period, you can specify a period to view monitoring data. The options are as follows:
Real-time, last 3 hours, last 6 hours, last 24 hours, last 1 week, last 1 month, last 3 months, last 6 months, and custom time range
- Click View to view monitoring data in a specified period.
- You can view Health Status and Roles of each service on the Service Summary page of MRS Manager.
- Click
 above the curve chart to view details about a metric.
- Customize a monitoring report.
Click Customize and select monitoring metrics to be displayed on MRS Manager. Click OK to save the selected monitoring metrics for display. Click Clear to cancel all the selected monitoring metrics in a batch.
MRS Manager supports a maximum of 14 monitoring metrics, but at most 12 customized monitoring metrics can be displayed on the page.
- Set an automatic refresh interval or click
 for an immediate refresh. If you select Full Screen, the Dashboard window will be maximized.
The following refresh interval options are supported:
- Refresh every 60 seconds
- Refresh every 120 seconds
- Stop refreshing
- Export a monitoring report.
Select a period. Click Export. MRS Manager will generate a report about the selected monitoring metrics in a specified time of period. Select a directory to save the report.
To view the curve charts of monitoring metrics in a specified period, click View.
On MRS Manager, you can query the top, bottom, and average value curves of key service and host monitoring metrics, that is, the resource distribution information. MRS Manager allows you to view the monitoring data of the last hour.
You can also modify the resource distribution on MRS Manager to display both the top and bottom value curves in service and host resource distribution figures.
Resource distribution of some monitoring metrics is not recorded.
- View the resource distribution of service monitoring metrics.
- On MRS Manager page, click Services.
- Select the target service from the service list.
- Click Resource Distribution.
Select key metrics of the service from Metric. MRS Manager displays the resource distribution of the metrics in the last hour.
- View the resource distribution of host monitoring metrics.
- On MRS Manager, click Hosts.
- Click the name of the specified host in the host list.
- Click Resource Distribution.
Select key metrics of the host from Metrics. MRS Manager displays the resource distribution of the metrics in the last hour.
- Configure resource distribution.
- On MRS Manager, click System.
- In Configuration, click Configure Resource Contribution Ranking under Monitoring and Alarm.
- Change the number of resources to be displayed. The sum of the maximum value and minimum value of resource distribution cannot be greater than 5.
Set Number of Top Resources to the number of top values.
Set Number of Bottom Resources to the number of bottom values.
- Click OK to save the configurations.
- View the resource distribution of service monitoring metrics.
Feedback
Was this page helpful?
Provide feedbackThank you very much for your feedback. We will continue working to improve the documentation.See the reply and handling status in My Cloud VOC.
For any further questions, feel free to contact us through the chatbot.
Chatbot


