
Data Reports
Data reports include the alarm report, event report, event statistics analysis report, and event scoring report.
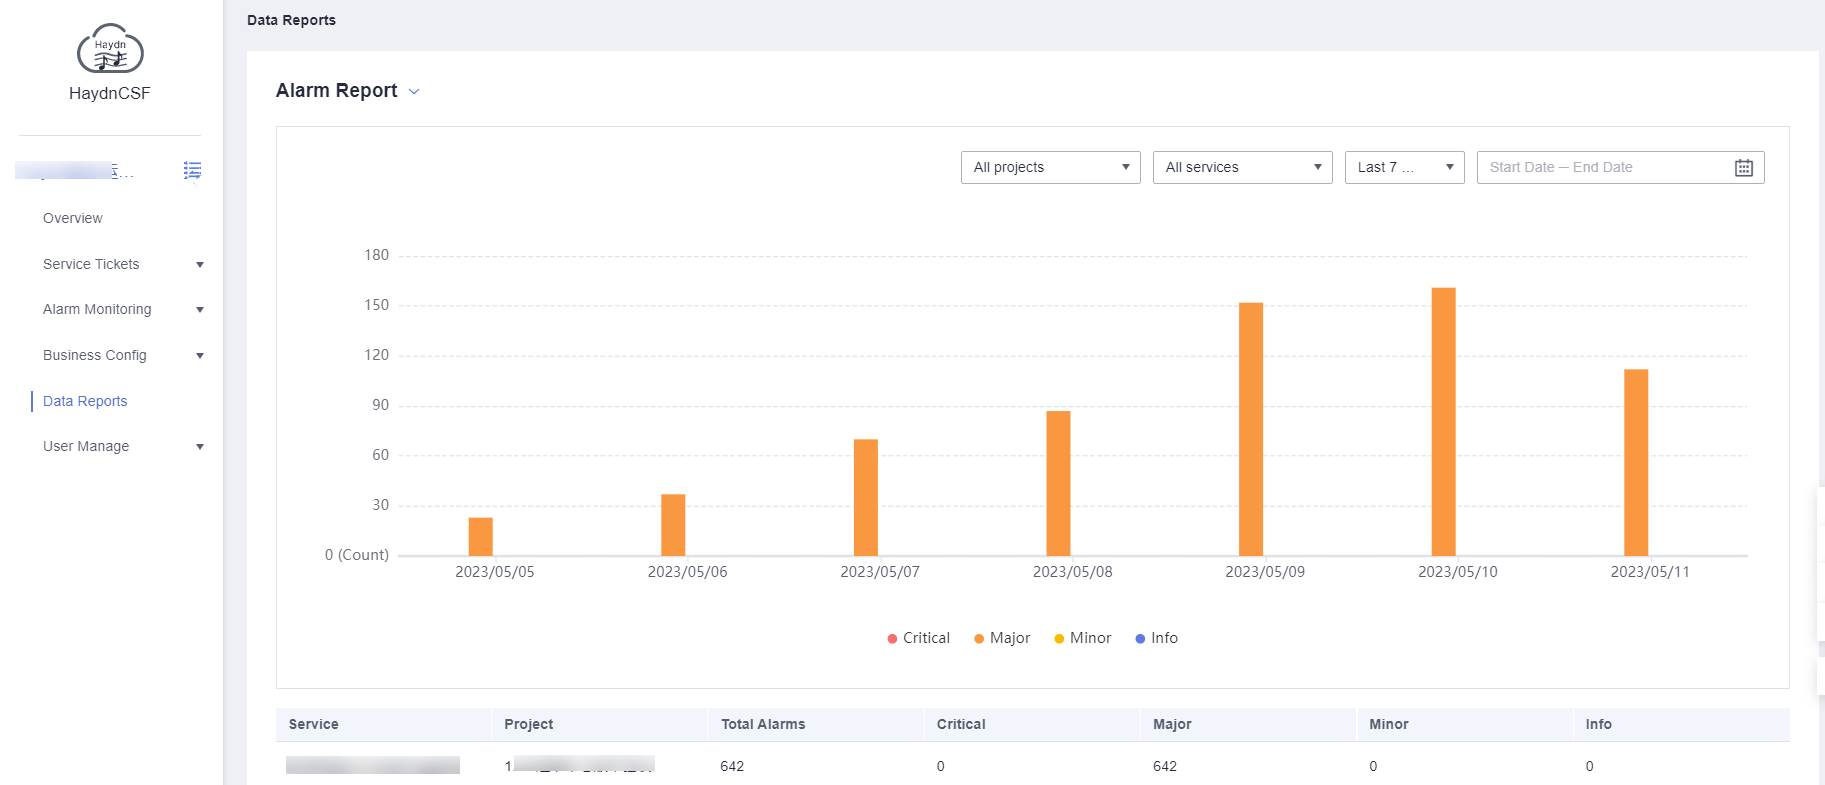
Alarm Report
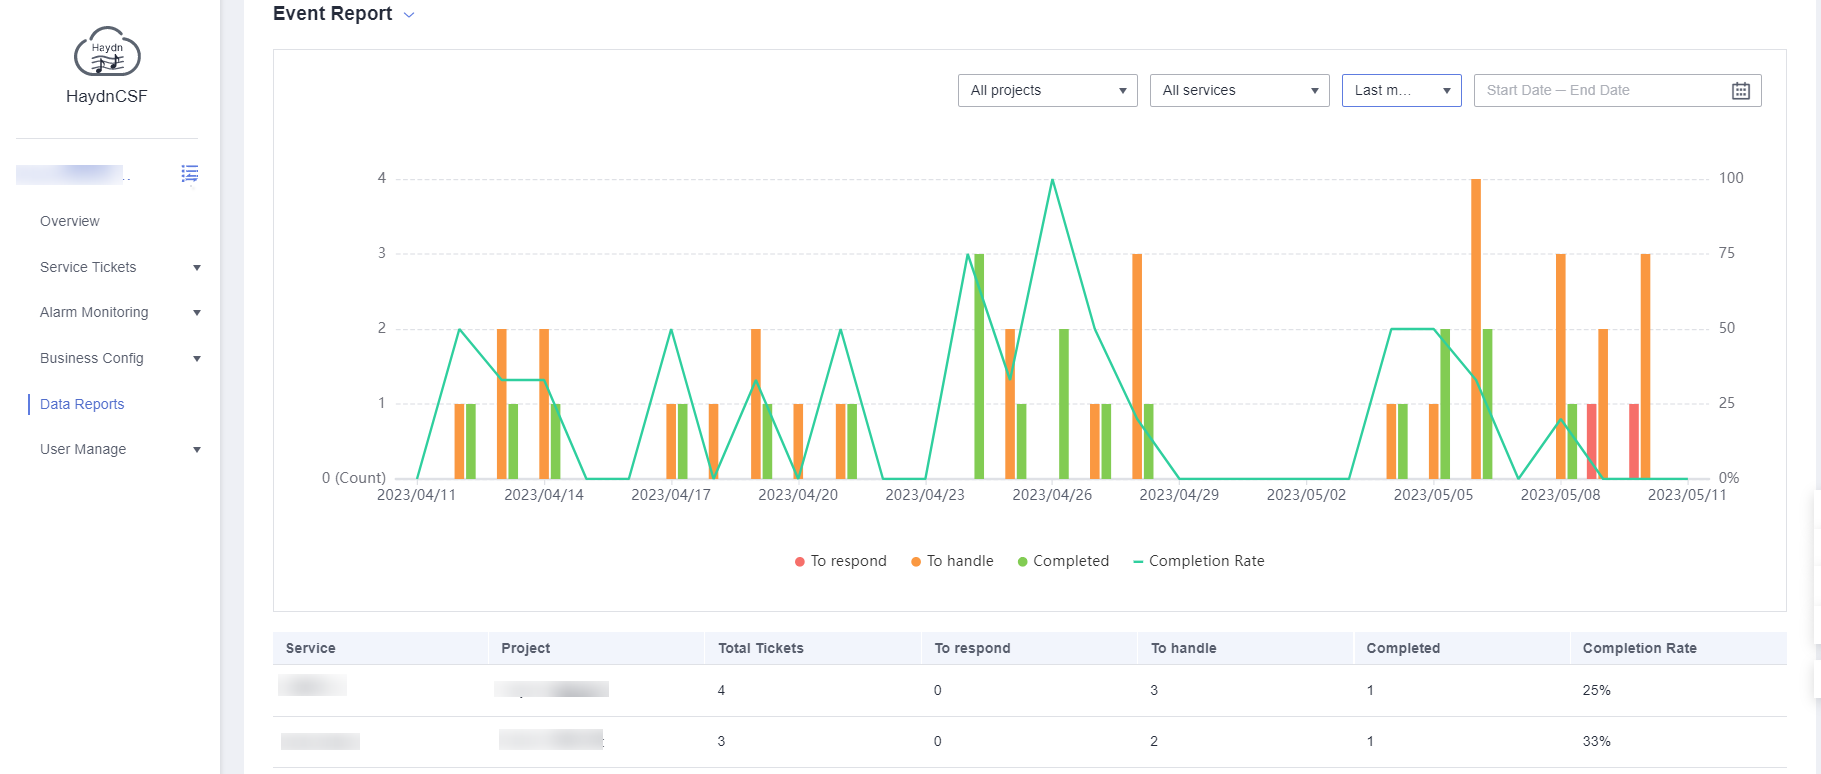
Event Report
Event Statistics Analysis Report
- The MTTA and MTTR trends of events are displayed in charts.
- In the bar chart, the horizontal axis represents the date on which events are generated, the left vertical axis represents the number of new events, and the right vertical axis represents the event response and handling time (minute).
- Different colors of bars show event severities in different phases.
- The purple line indicates the average event response duration, and the green line indicates the average event handling duration.
- In the lower part of the page, the list displays the number of events allocated to each service and each project, number of completed events, MTTA, MTTR, completion rate, and SLA fulfillment rate in the statistical period.
- Events can be filtered by project, service, last n days, and start and end time.
Figure 3 Event statistics analysis report
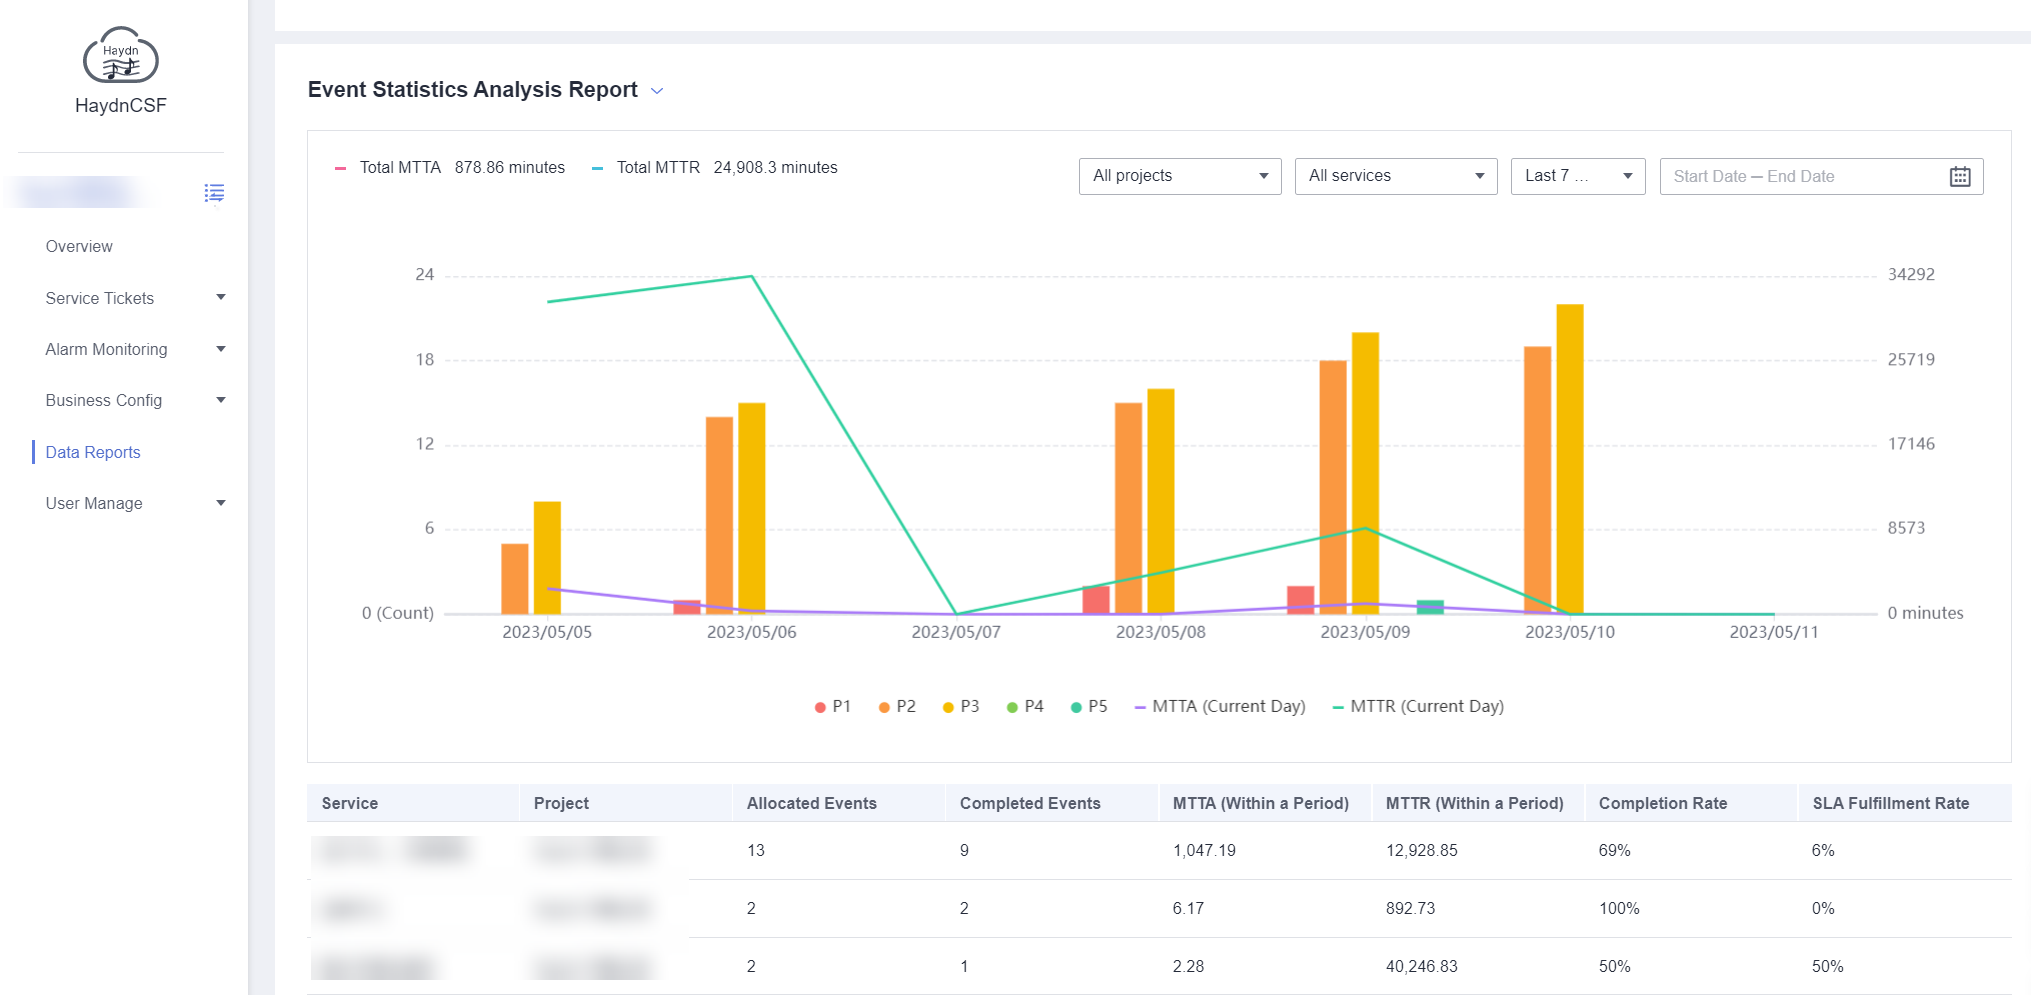

MTTA: mean time to acknowledge, which is the average time from when events are created to when engineers acknowledge the events. To calculate your MTTA, add up the time between event and acknowledgement, and then divide by the number of events.
MTTR: mean time to resolve, which is the average time from when events are responded to when events are resolved. To calculate your MTTR, add up the time between event response and resolution, and then divide by the number of events.
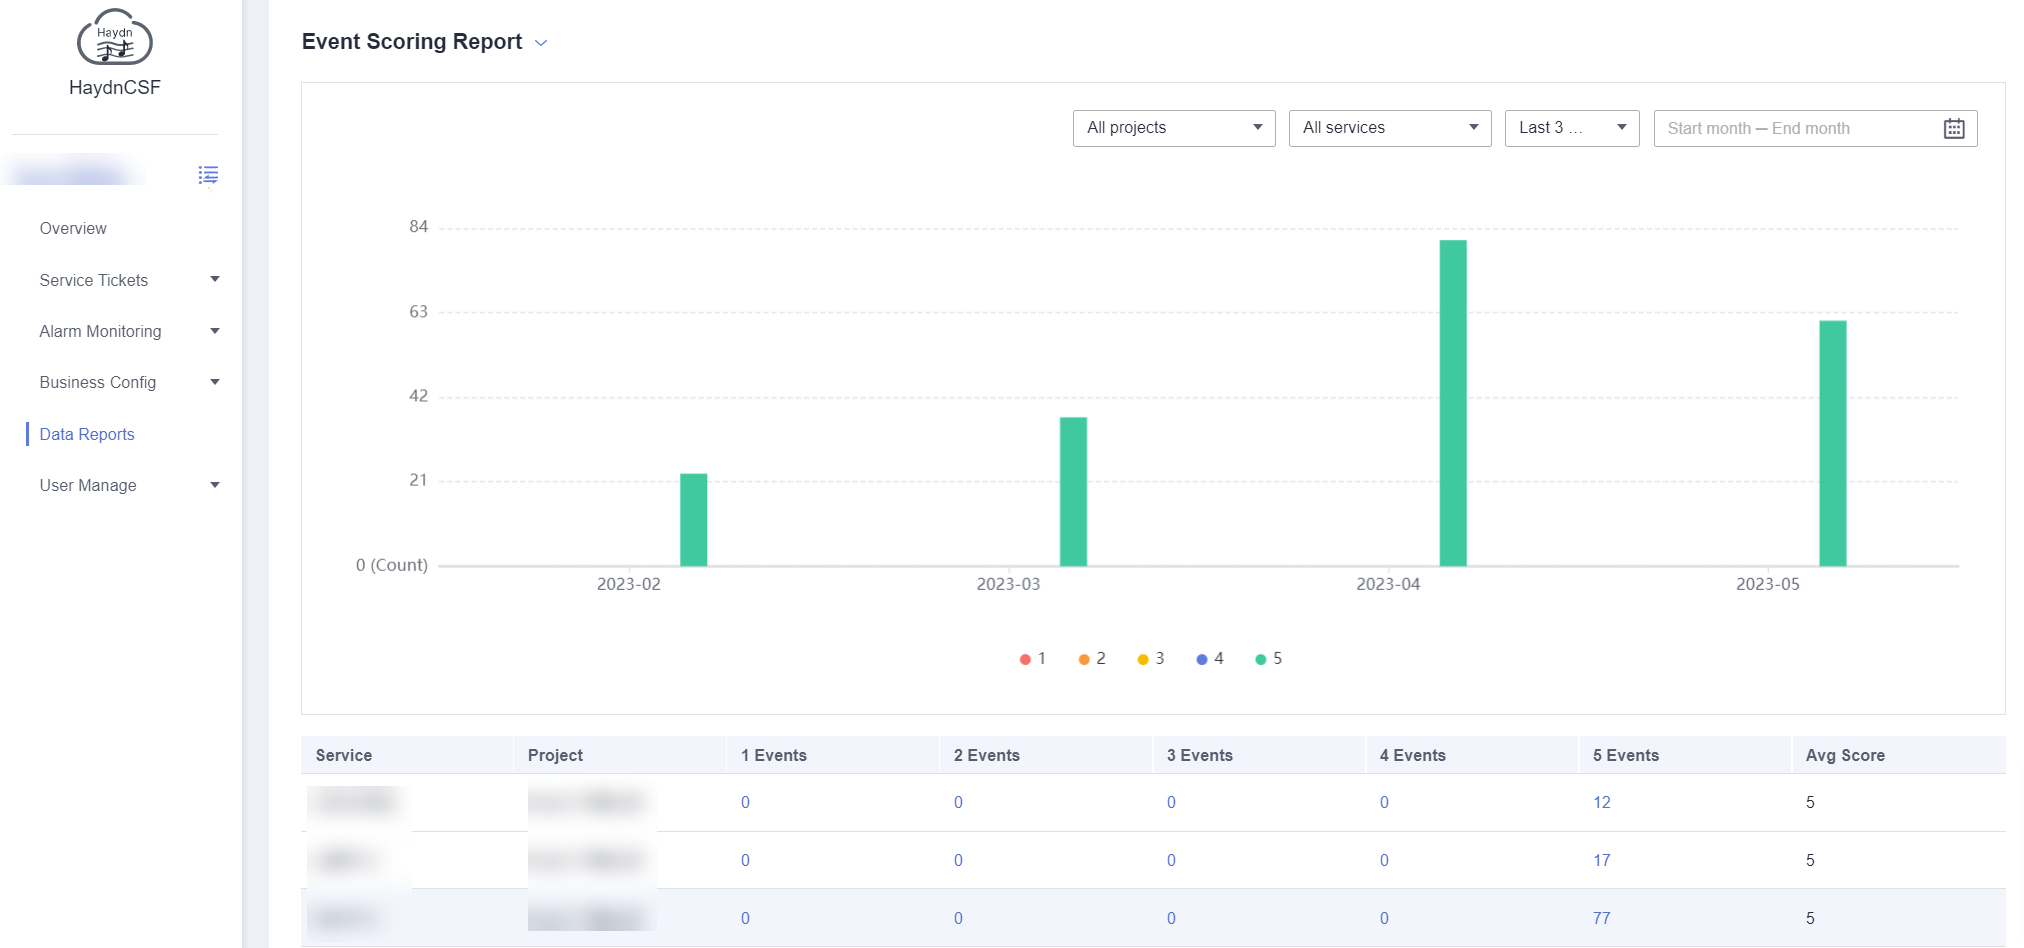
Event Scoring Report
Feedback
Was this page helpful?
Provide feedbackThank you very much for your feedback. We will continue working to improve the documentation.See the reply and handling status in My Cloud VOC.
For any further questions, feel free to contact us through the chatbot.
Chatbot


