

Viewing Cloud Eye Logs
Scenarios
After CTS is enabled, CTS starts recording operations on cloud resources. The CTS console stores the operation records of the last seven days.
This section describes how to query or export the operation records of the last seven days on the CTS console.
Viewing Traces in the Trace List
- Log in to the CTS console.
- In the navigation pane, choose Trace List.
- In the time range drop-down list above the trace list, select a desired query time range: Last 1 hour, Last 1 day, or Last 1 week. You can also specify a custom time range within the last seven days.
- The search box above the trace list supports advanced queries. Combine one or more filters to refine your search.
Table 1 Trace filtering parameters Parameter
Description
Read-Only
After selecting the Read-Only filter, you can select either Yes or No from the drop-down list.
- Yes: filters read-only operation traces, for example, resource query operations. This option is available after Read-Only Trace Reporting has been enabled in the Configuration Center and at least one read-only trace has been triggered.
- No: filters non-read-only operation traces, such as creating, modifying, and deleting resources.
Trace Name
Name of a trace.
The entered value is case-sensitive and requires an exact match. Fuzzy matching is not supported.
For details about the operations that can be audited for each cloud service, see Supported Services and Operations.
Example: updateAlarm
Trace Source
Cloud service name abbreviation.
The entered value is case-sensitive and requires an exact match. Fuzzy matching is not supported.
Example: IAM
Resource Name
Name of a cloud resource involved in a trace.
The entered value is case-sensitive and requires an exact match. Fuzzy matching is not supported.
If the cloud resource involved in the trace does not have a resource name or the corresponding API operation does not involve the resource name parameter, leave this field empty.
Example: ecs-name
Resource ID
ID of a cloud resource involved in a trace.
The entered value is case-sensitive and requires an exact match. Fuzzy matching is not supported.
Leave this field empty if the resource has no resource ID or if resource creation failed.
Example: {VM ID}
Trace ID
Value of the trace_id parameter for a trace reported to CTS.
The entered value requires an exact match. Fuzzy matching is not supported.
Example: 01d18a1b-56ee-11f0-ac81-******1e229
Resource Type
Type of a resource involved in a trace.
The entered value is case-sensitive and requires an exact match. Fuzzy matching is not supported.
For details about the resource types of each cloud service, see Supported Services and Operations.
Example: user
Operator
User who triggers a trace.
Select one or more operators from the drop-down list.
If the value of trace_type in a trace is SystemAction, the operation is triggered by the service and the trace's operator may be empty.
For details about the relationship between IAM identities and operators and the operator username format, see Relationship Between IAM Identities and Operators.
Trace Status
Select one of the following options from the drop-down list:
- normal: The operation succeeded.
- warning: The operation failed.
- incident: The operation caused a fault that is more serious than a normal failure, for example, causing other faults.
Enterprise Project ID
ID of the enterprise project to which a resource belongs.
To check enterprise project IDs, go to the Enterprise Project Management Service (EPS) console and choose Project Management in the navigation pane.
Example: b305ea24-c930-4922-b4b9-******1eb2
Access Key
Temporary or permanent access key ID.
To check access key IDs, hover over your username in the upper right corner of the console and select My Credentials from the pop-up list. On the displayed page, choose Access Keys in the navigation pane.
Example: HSTAB47V9V*******TLN9
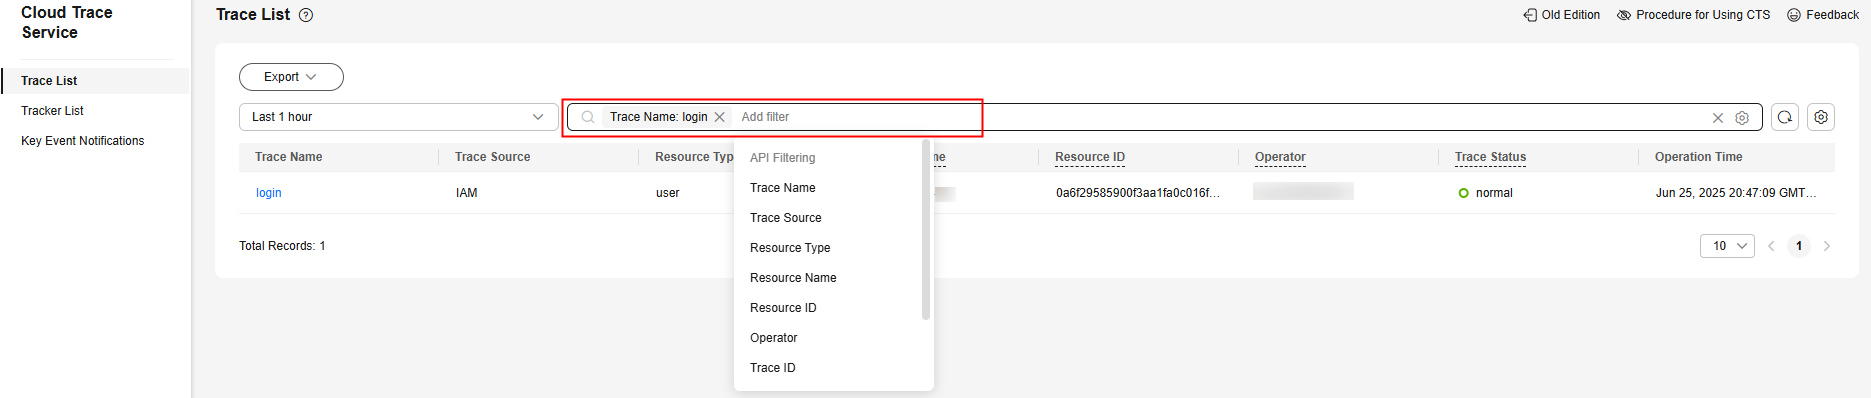
- On the Trace List page, you can also export and refresh the trace list, and customize columns to display.
- Enter any keyword in the search box and press Enter to filter desired traces.
- Click Export to export all traces in the query result as an .xlsx file. The file can contain up to 5,000 records.
- Click
 to view the latest information about traces.
 - Click
 to customize the information to be displayed in the trace list. If Auto wrapping is enabled (
 ), excess text will move down to the next line; otherwise, the text will be truncated. By default, this function is disabled.
What is your overall rating for this page?
Thank you very much for your feedback. We will continue working to improve the documentation.See the reply and handling status in My Cloud VOC.
For any further questions, feel free to contact us through the chatbot.
Chatbot


