Analyzing Driving Behavior Data in IoV Scenarios Using DLI
Scenario
Cloud computing and big data provide companies with data analysis and mining capabilities required in the Internet of Vehicle (IoV) field, helping companies or department of motor vehicles manage and analyze vehicle and driving behavior data quickly and scientifically.
Solution Architecture
DLI can query the records of vehicle driving features based on the detail records and freight order data regularly reported by the freight forwarder.
Data Types describes the data types used by DLI to record the data.

Process
To use DLI to analyze driving behavior data, perform the following steps:
Step 1: Uploading Data. Upload the data to OBS.
Step 2: Analyzing Data. Use DLI to query the data.
Example Code
Download the data package for sample data and detailed SQL statements.
Solution Advantages
- Free of data migration: DLI can interconnect with multiple data sources. You only need to create SQL tables and map data sources.
- Easy to use: You can use standard SQL statements to compile metric analysis logic without paying attention to the complex distributed computing platform.
- Pay-per-use: Log analysis is scheduled periodically based on time-critical requirements. There is a long idle period between every two scheduling operations. DLI uses the pay-per-use billing mode, which effectively reduces your costs.
Resource Planning and Costs
|
Resource |
Description |
Cost |
|---|---|---|
|
OBS |
You need to create an OBS bucket and upload data to OBS for data analysis using DLI. |
You will be charged for using the following OBS resources:
The actual fee depends on the size of the stored file, the number of user access requests, and the traffic volume. Estimate the fee based on your service requirements. |
|
DLI |
Before creating a SQL job, you need to purchase a queue. When using queue resources, you are billed based on the CUH of the queue. |
For example, if you purchase a pay-per-use queue, you will be billed based on the number of CUHs used by the queue. Usage is billed by the hour, with any usage less than one hour being rounded up to one hour. The number of hours is calculated on the hour. CUH pay-per-use billing = Unit price x Number of CUs x Number of hours. |
Data Types
- Detail records
Detail records include the regularly reported location records and data of alarms triggered by abnormal driving behavior.
Table 2 Detail records Field
Data Type
Description
driverID
string
Driver ID
carNumber
string
License plate number
latitude
double
Latitude
longitude
double
Longitude
speed
int
Speed
direction
int
Direction
siteName
string
Site name
time
timestamp
Report time of the records
isRapidlySpeedup
int
Whether the vehicle rapidly speeds up. 1 indicates that the vehicle suddenly speeds up, and 0 indicates that the vehicle does not.
isRapidlySlowdown
int
Whether the vehicle suddenly slows down.
isNeutralSlide
int
Whether the vehicle is coasting.
isNeutralSlideFinished
int
Whether vehicle coasting has stopped.
neutralSlideTime
bigint
Time length of vehicle coasting.
isOverspeed
int
Whether the vehicle is speeding.
isOverspeedFinished
int
Whether the vehicle stops speeding.
overspeedTime
bigint
Duration of the vehicle speeding
isFatigueDriving
int
Whether fatigue driving occurs.
isHthrottleStop
int
Whether the driver revs the engine in neutral.
isOilLeak
int
Abnormal oil consumption
- Order data
Order data refers to the records of freight orders.
Table 3 Order data Field
Data Type
Description
orderNumber
string
Order ID
driverID
string
Driver ID
carNumber
string
License plate number
customerID
string
Customer ID
sourceCity
string
Departure
targetCity
string
Destination
expectArriveTime
timestamp
Expected delivery time
time
timestamp
Time when a record is generated.
action
string
Event type, including creating an order, dispatching goods, delivering packages, and signing orders.
Step 1: Uploading Data
- Download OBS Browser+. For details about the download address, see Object Storage Service Tool Guide.
- Install OBS Browser+. For details about the installation procedure, see Object Storage Service Tool Guide.
- Log in to OBS Browser+. OBS Browser+ supports two login modes: AK login (using access keys) or authorization code login. For details about the login procedure, see Object Storage Service Tool Guide.
- Upload data using the OBS browser+.
Start the OBS Browser+, click Create Bucket on the homepage. Select a region and enter a bucket name (for example, DLI-demo). After the bucket is created, return to the bucket list and click DLI-demo. OBS Browser+ supports upload by dragging. You can drag one or more files or folders from a local path to the object list of a bucket or a parallel file system on OBS Browser+. You can even drag a file or folder directly to a specified folder on OBS Browser+.
Obtain the test data by downloading the Best_Practice_01.zip file and decompressing it. Perform the following operations:
- Detail records: Upload the detail-records folder in the Data directory to the root directory of the OBS bucket.
- Order data: Upload the order-records folder in the Data directory to the root directory of the OBS bucket.
Step 2: Analyzing Data
Use DLI to query the data for analysis.
- Creating a Database and a Table
- On the homepage of the management console, choose Service List > Analytics > Data Lake Insight.
- On the DLI console, click SQL Editor.
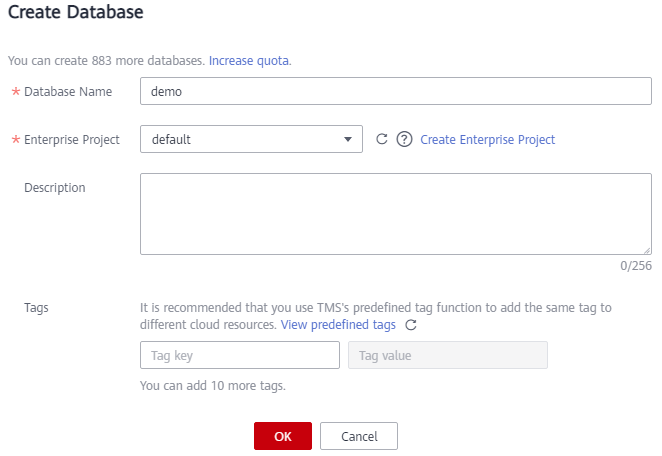
- In the left pane of the SQL Editor, select the Databases tab and click
 to create the demo database.
Figure 2 Creating a database

Database Name cannot be set to default because default is the built-in database.
- Choose the demo database, and enter the following SQL statement in the editing box:
create table detail_records(
  driverID String,
  carNumber String,
  latitude double,
  longitude double,
  speed int,
  direction int,
  siteName String,
  time timestamp,
  isRapidlySpeedup int,
  isRapidlySlowdown int,
  isNeutralSlide int,
  isNeutralSlideFinished int,
  neutralSlideTime long,
  isOverspeed int,
  isOverspeedFinished int,
  overspeedTime long,
  isFatigueDriving int,
  isHthrottleStop int,
  isOilLeak int) USING CSV OPTIONS (PATH 'obs://dli-demo/detail-records/');

Replace the file path in the preceding statement with the actual OBS path where the detail records are stored.
- Click Execute to create the detail_records table. See Figure 3.
- Run the following SQL statements to create the event_records table in the demo database. The operation is similar to 1.d and 1.e.
create table event_records(
  driverID String,
  carNumber String,
  latitude double,
  longitude double,
  speed int,
  direction int,
  siteName String,
  time timestamp,
  isRapidlySpeedup int,
  isRapidlySlowdown int,
  isNeutralSlide int,
  isNeutralSlideFinished int,
  neutralSlideTime long,
  isOverspeed int,
  isOverspeedFinished int,
  overspeedTime long,
  isFatigueDriving int,
  isHthrottleStop int,
  isOilLeak int)
- Run the following SQL statements to extract the alarm and event data from the detail records and insert it into the event_records table.
insert into table event_records
(select *
from detail_records
where isRapidlySpeedup > 0
OR isRapidlySlowdown > 0
OR isNeutralSlide > 0
OR isNeutralSlideFinished > 0
OR isOverspeed > 0
OR isOverspeedFinished > 0
OR isFatigueDriving > 0
OR isHthrottleStop > 0
OR isOilLeak > 0)
- Use another method to create the order_records table.
On the left of the SQL job editor, click the Databases tab and click the demo database. Click the plus icon (+) on the right of Table to create a table, and set Data Location to DLI. Set the column types according to Order data.Figure 4 Creating the order_records table

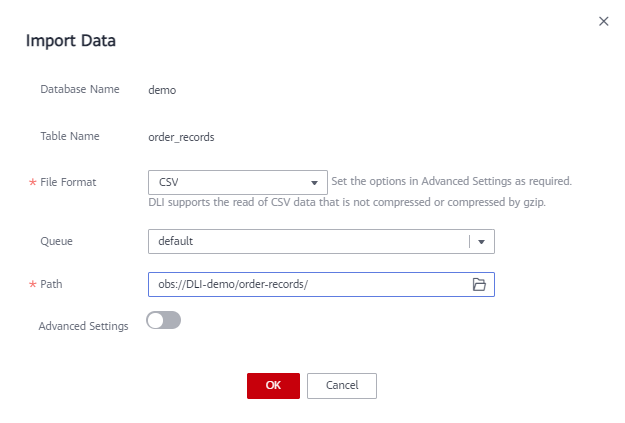
- Import the OBS data to the order_records table. Choose Data Management > Databases and Tables. Click the demo database to go to the table management page. In the Operation column of the order_records table, choose More > Import. Set File Format to CSV, the data storage path to obs://DLI-demo/order-records/, and retain default values for the rest parameters. Click OK.

The default timestamp format is yyyy-MM-dd HH:mm:ss. To use other formats, select Advanced Settings and enter the desired timestamp format (not modified in this example).
Figure 5 Importing table data
- Querying Data
- Run the following SQL statements to query the alarm events of all drivers in a certain time period.

You can save the frequently-used query statements as a template by clicking More > Save as Template in the upper right corner of the editing window. The template is available for future use or can be modified in the SQL editor again.
Choose Job Templates > SQL Templates and click the Custom Templates tab. In the Operation column of the target template, click Execute to switch to the SQL editor. You can modify it as needed.
select
  driverID,
  carNumber,
  sum(isRapidlySpeedup) as rapidlySpeedupTimes,
  sum(isRapidlySlowdown) as rapidlySlowdownTimes,
  sum(isNeutralSlide) as neutralSlideTimes,
  sum(neutralSlideTime) as neutralSlideTimeTotal,
  sum(isOverspeed) as overspeedTimes,
  sum(overspeedTime) as overspeedTimeTotal,
  sum(isFatigueDriving) as fatigueDrivingTimes,
  sum(isHthrottleStop) as hthrottleStopTimes,
  sum(isOilLeak) as oilLeakTimes
from
  event_records
where
  time >= "2017-01-01 00:00:00"
  and time <= "2017-02-01 00:00:00"
group by
  driverID,
  carNumber
order by
  rapidlySpeedupTimes desc,
  rapidlySlowdownTimes desc,
  neutralSlideTimes desc,
  neutralSlideTimeTotal desc,
  overspeedTimes desc,
  overspeedTimeTotal desc,
  fatigueDrivingTimes desc,
  hthrottleStopTimes desc,
  oilLeakTimes desc
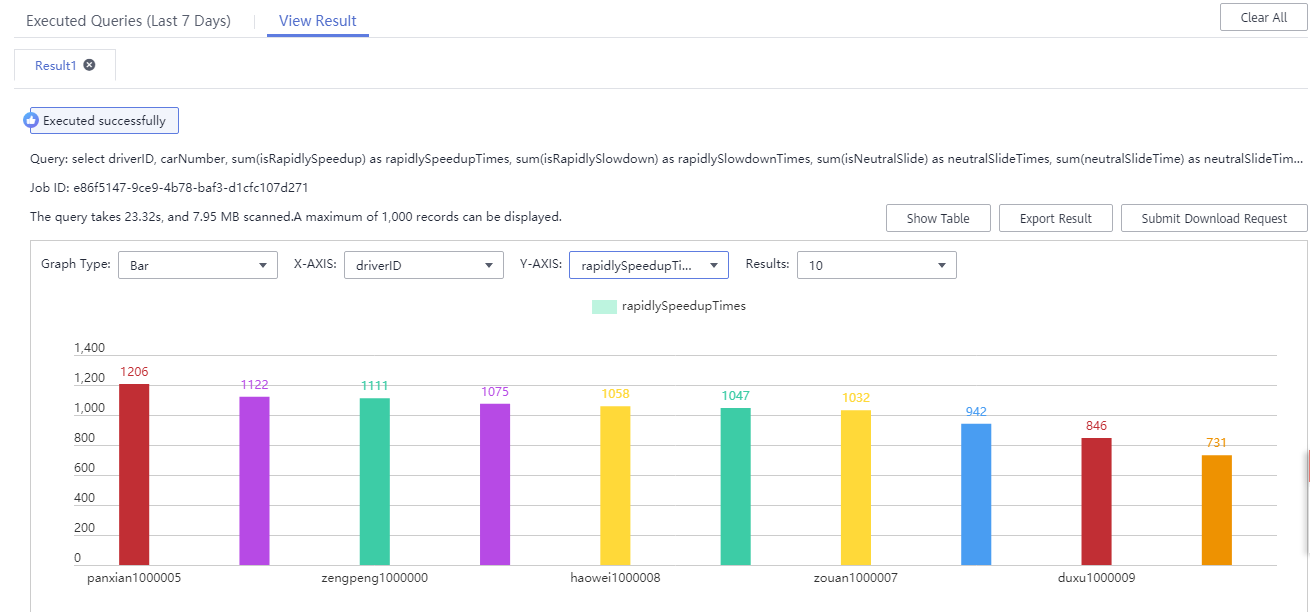
In the query result, click
 to view graphical results.
- Set Graph Type to the bar chart.
- Set X-AXIS to driverID.
- Set Y-AXIS to rapidlySpeedupTimes.
- Set Results to 10.
The command output is as follows:
Figure 6 Rapid acceleration
- Run the following SQL statement to query the detailed record of a driver in a certain time period.
select
  *
from
  event_records
where
  driverID = "panxian1000005"
  and time >= "2017-01-01 00:00:00"
  and time <= "2017-02-01 00:00:00"
In the query result, click
 to view graphical results.
- Set Graph Type to the bar chart.
- Set X-AXIS to driverID.
- Set Y-AXIS to speed.
- Set Results to 10.
The command output is as follows:
Figure 7 Speeding record
- Run the following SQL statement to query the order information.
select
  *
from
  order_records
where
  orderNumber = "2017013013584419488"
order by
  time desc
Figure 8 Order information
- Run the following SQL statement to query a vehicle's driving feature according to the driver ID and time of departure.
select
  driverID,
  carNumber,
  latitude,
  longitude,
  siteName,
  time
from
  detail_records
where
  driverID = "panxian1000005"
  and time > "2017-01-30 16:00:00"
  and siteName IS NOT NULL
order by
  time desc
In the query result, click
 to view graphical results.
- Set Graph Type to the bar chart.
- Set X-AXIS to time.
- Set Y-AXIS to latitude.
- Set Results to 10.
The command output is as follows:
Figure 9 Driving information
- Run the following SQL statements to query the alarm events of all drivers in a certain time period.
Feedback
Was this page helpful?
Provide feedbackThank you very much for your feedback. We will continue working to improve the documentation.See the reply and handling status in My Cloud VOC.
For any further questions, feel free to contact us through the chatbot.
Chatbot


