

Viewing Real-Time Performance Metrics
Scenarios
TaurusDB provides real-time performance monitoring. You can use standard views to observe instance performance metrics and trends in real time, or create custom views for specific metrics. Alarm records help you identify and address potential performance issues in a timely manner.
Viewing Real-Time Metrics
- Log in to the TaurusDB console.
- Click
 in the upper left corner and select a region.
 - On the Instances page, click the target instance name.
- In the navigation pane, choose Performance under DBA Assistant. You can view metrics in the standard or custom view.
- Standard view
Click the Standard View tab to view performance metrics of the instance.
Click Select Metric to add or delete performance metrics.
Figure 1 Showing the classic view

- Custom view
Click the Custom View tab and click
 . In the displayed dialog box, enter a chart name, select the metrics you want to monitor from the available options, click
  to add them to the selected list, and click OK.
After the view is created, you can view the metric trends or click
 to create more monitoring views.Figure 2 Creating a chart
 Figure 3 Viewing the monitoring view

- Standard view
Configuring Monitoring by Seconds
- Log in to the TaurusDB console.
- Click in the upper left corner and select a region.
- On the Instances page, click the instance name.
- In the navigation pane, choose Performance under DBA Assistant.
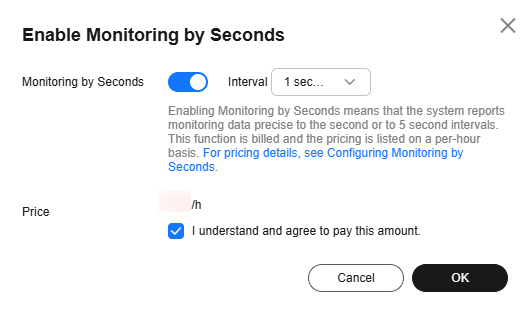
- Click Enable Monitoring by Seconds.
- In the displayed dialog box, enable Monitoring by Seconds and click OK.
- This function is unavailable for any DB instances with fewer than eight vCPUs.
- Once you turn on this function, the system will report monitoring data again and show it in about 5 minutes.
- You can turn off this function if needed. Once it is turned off, the system will report monitoring data again and show it in about 5 minutes.
Figure 4 Enabling monitoring by seconds
Viewing Alarm Records
- Log in to the TaurusDB console.
- Click in the upper left corner and select a region.
- On the Instances page, click the target instance name.
- In the navigation pane, choose Performance under DBA Assistant and click the Alarm Records tab.
- In the alarm list, you can view details such as alarm severities (critical, major, minor, or warning), alarm duration, and alarm rules. Figure 5 Alarm details

- Viewing an alarm rule
Click an alarm rule name to go to Cloud Eye and view the monitored object, alarm policy, and alarm notification settings.
Figure 6 Viewing an alarm rule

- Viewing monitoring details
Click Monitor Details in the Operation column to view the monitoring metrics of an alarm.
Figure 7 Viewing monitoring details

- Viewing an alarm rule
What is your overall rating for this page?
Thank you very much for your feedback. We will continue working to improve the documentation.See the reply and handling status in My Cloud VOC.
For any further questions, feel free to contact us through the chatbot.
Chatbot


