
Viewing Details About a Standard Dedicated Resource Pool
Resource Pool Details Page
- Log in to the ModelArts console. In the navigation pane on the left, choose Standard Cluster under Resource Management.
- You can search for the resource pools by name, ID, resource pool status, node status, resource pool type, and creation time.
Click Records in the upper right corner to view the resource pool operation information.
Click Failed Records in the upper right corner to view the failed resource pools.
- In the resource pool list, click a resource pool to go to its details page and view its information.
- If there are multiple ModelArts Standard resource pools, click
 in the upper left corner of the details page of one resource pool to switch between resource pools.
 - For a pay-per-use standard resource pool: On the details page, click More in the upper right corner to scale in/out, delete a resource pool, change the billing mode to yearly/monthly, and perform other operations. Operations that can be performed vary depending on resource pools.
- For a yearly/monthly standard resource pool: On the details page, click More in the upper right corner to perform operations such as scale-out, unsubscription, renewal, auto-renewal enabling or modification, driver upgrade, and job type setting. Operations that can be performed vary depending on resource pools.
- In the Network area of Basic Information, you can click the number of resource pools associated to view associated resource pools. You can view the number of available IP addresses on the network.
- In the extended information area, you can view the monitoring, jobs, nodes, specifications, events, tags, logical subpools, and plug-ins. For details, see the following section.
- If there are multiple ModelArts Standard resource pools, click
Viewing Jobs in a Resource Pool
On the resource pool details page, click Jobs. You can view all jobs running in the resource pool. If a job is queuing, you can view its queuing position.

Currently, only training jobs and inference jobs can be viewed.
Viewing Resource Pool Events
On the resource pool details page, click Events. You can view all events of the resource pool. The cause of an event is PoolStatusChange or PoolResourcesStatusChange.
In the event list, click  on the right of Event Type to filter events.
- When a resource pool starts to be created or becomes abnormal, the resource pool status changes and the change will be recorded as an event.
- When the number of nodes that are available or abnormal or in the process of being created or deleted changes, the resource pool node status changes and the change will be recorded as an event.

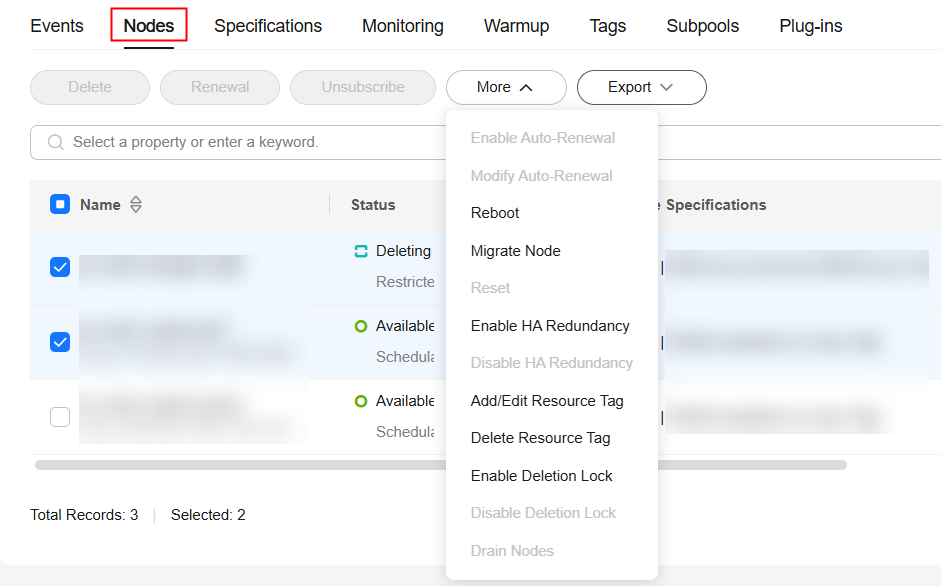
Viewing Resource Pool Nodes
On the resource pool details page, click Nodes. You can view all nodes in the resource pool and the resource usage of each node. Hover the cursor over the node to obtain the node name and resource ID. You can use the resource ID to obtain the bills or query the billing information of yearly/monthly resources in the Billing Center.
Some resources are reserved for cluster components. Therefore, CPUs (Available/Total) does not indicate the number of physical resources on the node. It only displays the number of resources that can be used by services. CPU cores are metered in milicores, and 1,000 milicores equal 1 physical core.
You can delete, unsubscribe from, reset, or restart nodes in batches, or enable or disable HA redundancy for nodes in batches, as shown in the following figure. For details, see Rectifying a Faulty Node in a Standard Dedicated Resource Pool. You can add, edit, and delete resource tags for nodes in batches. You can renew yearly/monthly nodes and enable or modify auto-renewal for them in batches.
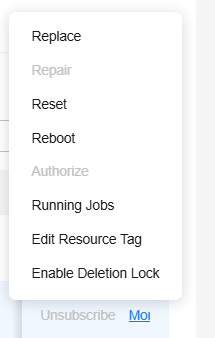
To delete, replace, rectify, reset, restart, authorize a node, and enable or disable HA redundancy for a single node, locate the target node in the list and click the button in the Operation column. For details, see Rectifying a Faulty Node in a Standard Dedicated Resource Pool. You can view the running jobs of a single node. For details, see View the Running Jobs of a Resource Pool Node. You can view the plug-in resource usage of a single node. For details, see Querying Plug-in Component. You can also edit resource tags.
In the node search box, you can search for nodes by node name, node status, HA redundancy, batch, driver version, driver status, IP address, and resource tag.
You can export the node information of a standard resource pool to an Excel file. Select the node names, click Export > Export All Data to XLSX or Export > Export Part Data to XLSX above the node list, and click  in the browser to view the exported Excel files.
On the node list page, click  to customize the information displayed in the node list.
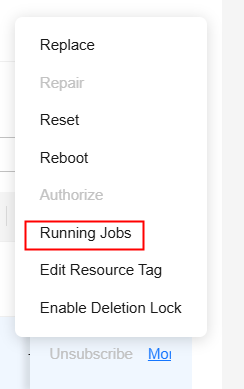
View the Running Jobs of a Resource Pool Node
In the Nodes tab of the resource pool details page, you can view the running jobs of a single node.
To do so, locate the node and choose More > Running Jobs in the Operation column. In the displayed dialog box, you can view the running jobs of the node by searching for the keyword.
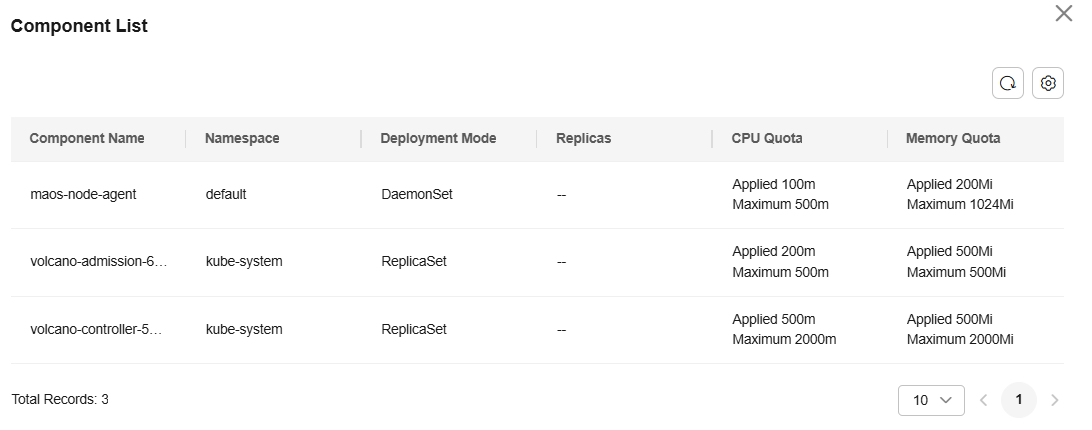
Querying Plug-in Component
On the resource pool details page, choose Node Management from the navigation pane to view the plug-in usage of the current node.
To view the instance usage of the plug-in, locate the target node and choose More > Query Plug-in Component in the Operation column.
Viewing Resource Pool Specifications
On the resource pool details page, click Specifications. You can view the resource specifications used by the resource pool and the number of resources corresponding to the specifications, and adjust the container engine space.

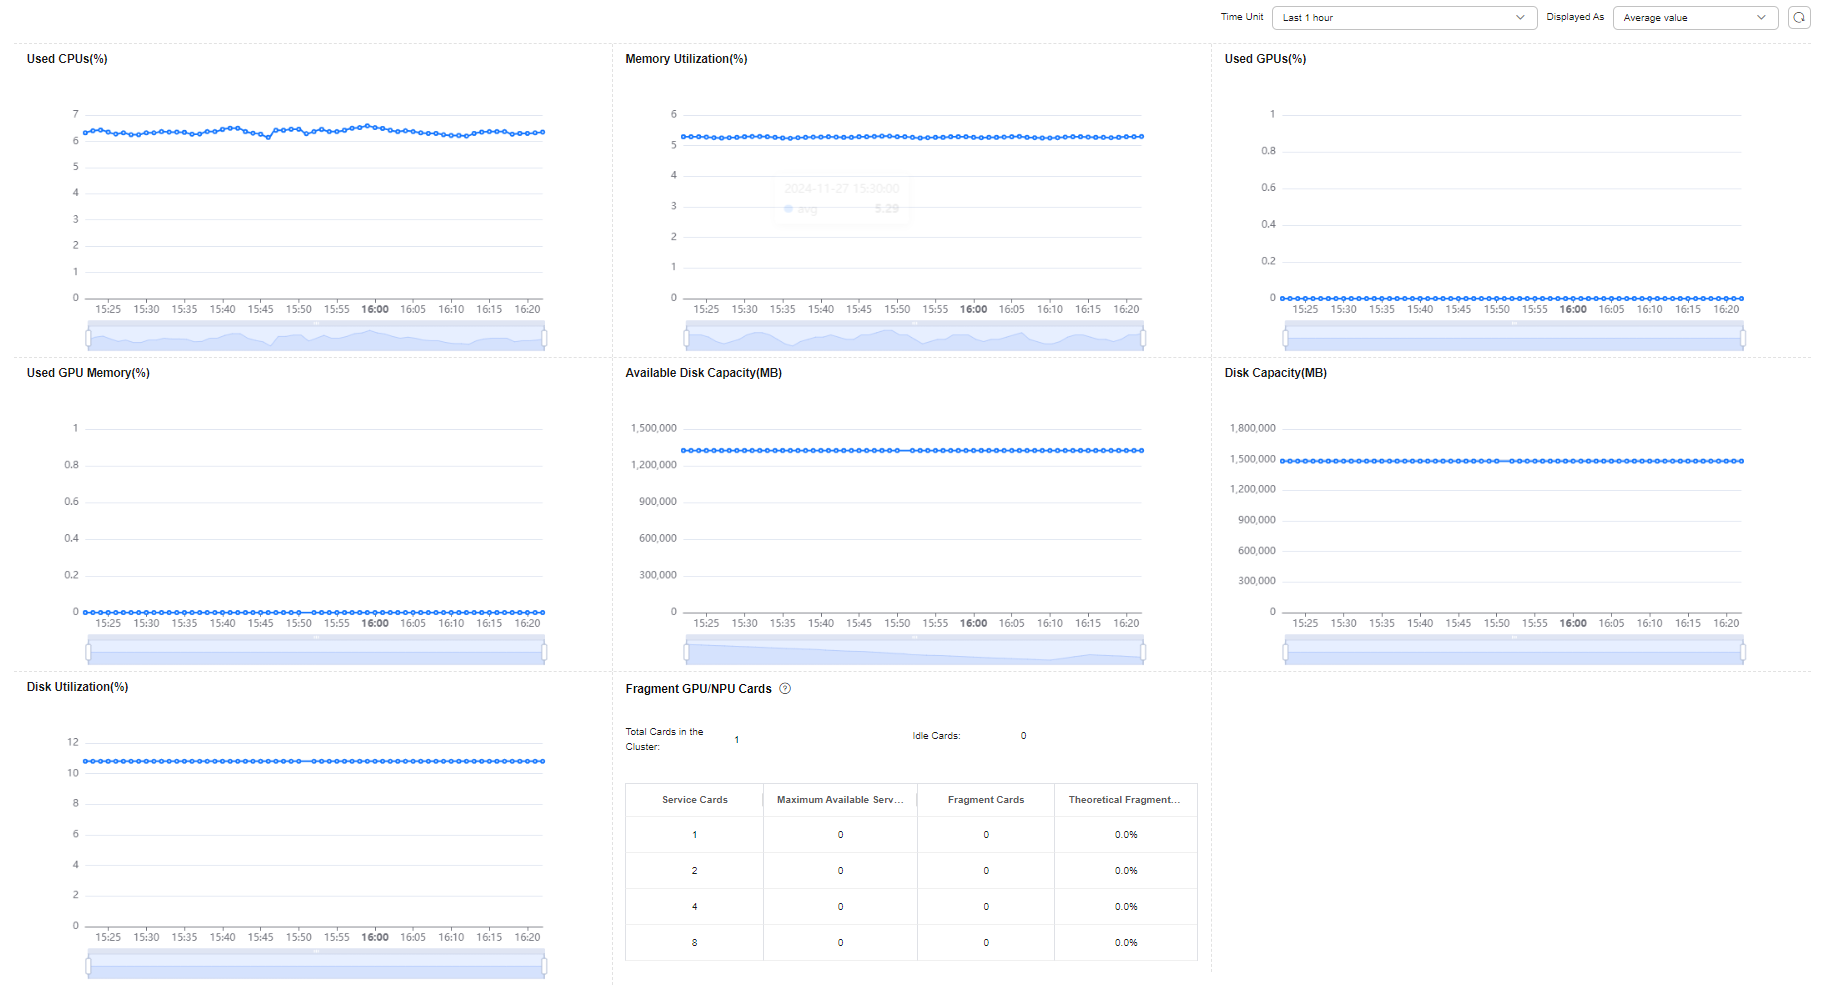
Viewing Resource Pool Monitoring Information
On the resource pool details page, click Monitoring. The resource usage including used CPUs, memory usage, and available disk capacity of the resource pool is displayed. If AI accelerators are used in the resource pool, the GPU and NPU monitoring information is also displayed.
You should set the statistical period to less than seven days. If the period is too long, the query may be delayed due to a large number of AOM metrics.
|
Parameter |
Description |
Unit |
Value Range |
|---|---|---|---|
|
Used CPUs |
CPU usage of a measured object |
% |
0%–100% |
|
Memory Utilization |
Percentage of the used physical memory to the total physical memory |
% |
0%–100% |
|
Used GPUs |
Percentage of the used GPUs to the total GPUs |
% |
0%–100% |
|
Used GPU memory |
Percentage of the used GPU memory to the total GPU memory |
% |
0%–100% |
|
Used NPUs |
Percentage of the used NPU memory to the total NPU memory |
% |
0%–100% |
|
Used NPU Memory |
Percentage of the used GPU memory to the total GPU memory |
% |
0%–100% |
|
Available Disk Capacity |
Available disk capacity of a measured object |
MB |
≥0 |
|
Disk Capacity |
Total disk capacity of a monitored object |
MB |
≥0 |
|
Disk Utilization |
Disk usage of the monitored object |
% |
0%–100% |
|
GPU/NPU Fragments |
Fragments are generated during resource scheduling. As a result, some PUs are idle but cannot be used by multi-PU tasks. For tasks with different numbers of PUs, fragments vary according to the distribution of occupied PUs and vary with time. The table lists only the status at the current time. |
/ |
/ |
Managing Resource Pool Tags
You can add tags to a resource pool for quick search.
On the resource pool details page, click Tags. You can view, search for, add, modify, and delete tags of a resource pool.
You can add up to 20 tags.
Managing Logical Subpools
You can split logical subpools from a ModelArts Standard dedicated resource pool and set resource quotas for each subpool, including reserved quotas and quota rollout. After a logical subpool is split, tasks in the training, inference, and development environments must be delivered to the logical subpool and restricted by the quota. Only tasks within the quota can be delivered and run.
On the resource pool details page, switch to the Logical Subpool tab. You can create, resize, and delete a logical subpool, as well as setting the job type for the subpool. For details, see Managing Logical Subpools of a Standard Dedicated Resource Pool.
Viewing Resource Pool Plug-ins
- ModelArts provides various plug-ins for you to selectively expand resource pool functions to meet service requirements.
- On the resource pool details page, click the Plug-ins tab. You can view the information about all plug-ins of the resource pool.
- Installing a plug-in: Locate the target plug-in, click Install, configure related information, and click OK. For details, see Managing Standard Dedicated Resource Pool Plug-ins.
Figure 8 Installing a plug-in

- View plug-in details: Click a plug-in name to view its details, including the introduction and component list.
Figure 9 Plug-in details

Checking the Disk Specifications of a Resource Pool
- On the resource pool details page, choose More > Scaling in the upper right corner. On the displayed page, you can view the disk type, size, quantity, write mode, container engine space, and mount path of the system disk, container disk, and data disk.
Feedback
Was this page helpful?
Provide feedbackThank you very much for your feedback. We will continue working to improve the documentation.See the reply and handling status in My Cloud VOC.
For any further questions, feel free to contact us through the chatbot.
Chatbot


