
Managing Reports
The HaydnCSF platform allows you to manage solution reports, test requirement reports, and issue reports. (On the HaydnCSF platform, click Workspaces. On the displayed page, click the workspace name. In the navigation pane on the left, choose Reports.)
Solution Reports
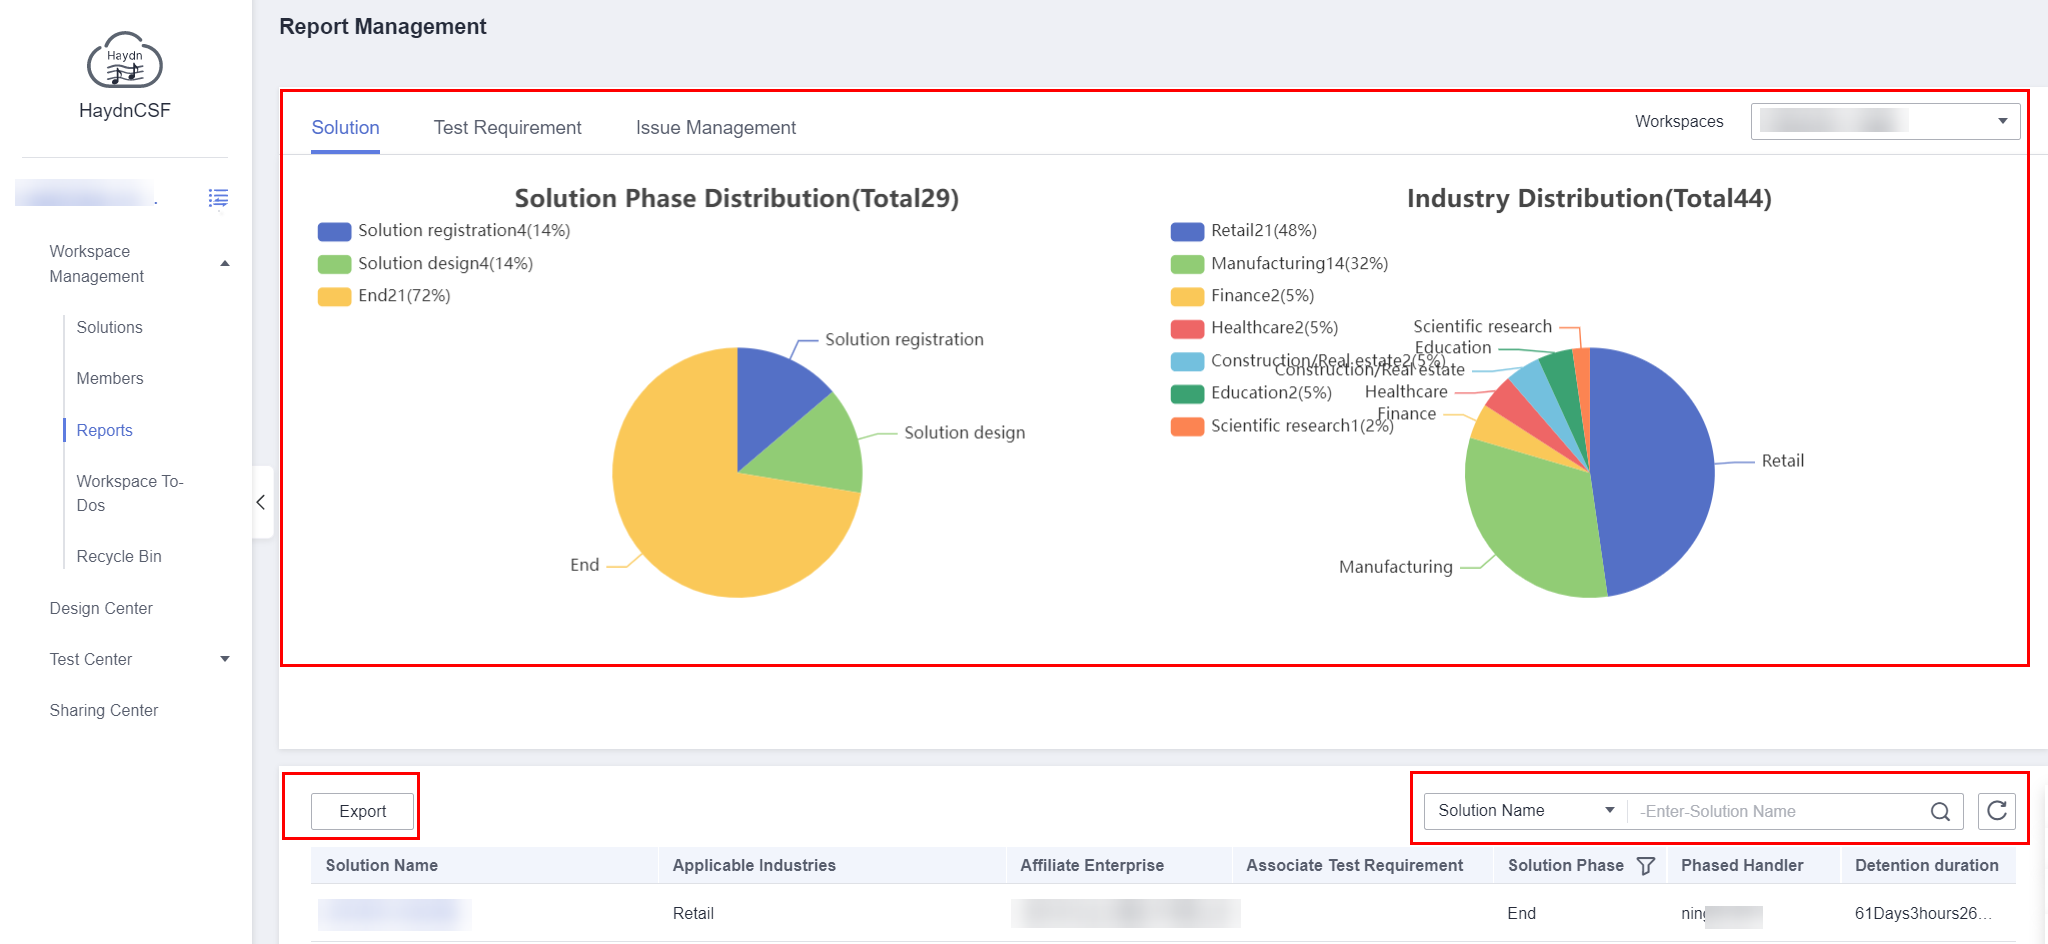
The Solutions page consists of three areas: solution phase distribution pie chart, industry distribution pie chart, and solution list in the workspace.
- Solution phase distribution pie chart: All solutions in the workspace are displayed by solution phase. There are four phases: solution registration, solution design, solution review, and design completion.
- Industry distribution pie chart: Solutions are displayed by industry that the solutions in the workspace belong to.
- Solution list: You can view the solution name, applicable industries, associated enterprise, associated test requirement, solution phase, handler, and retention duration. You can search for solutions by solution name and export solutions to an .xlsx file.
Test Requirement Reports
The Test Requirements page consists of three areas: test phase distribution pie chart, bar chart of average phase duration, and test requirement list.
- Test phase distribution pie chart: All test requirements in the workspace are displayed by test phase. There are nine test phases: test requirement submission, test requirement review, test plan formulation, test case design, test case review, test resource provisioning, test case execution, test report review, and completion.
Figure 2 Test requirement report page
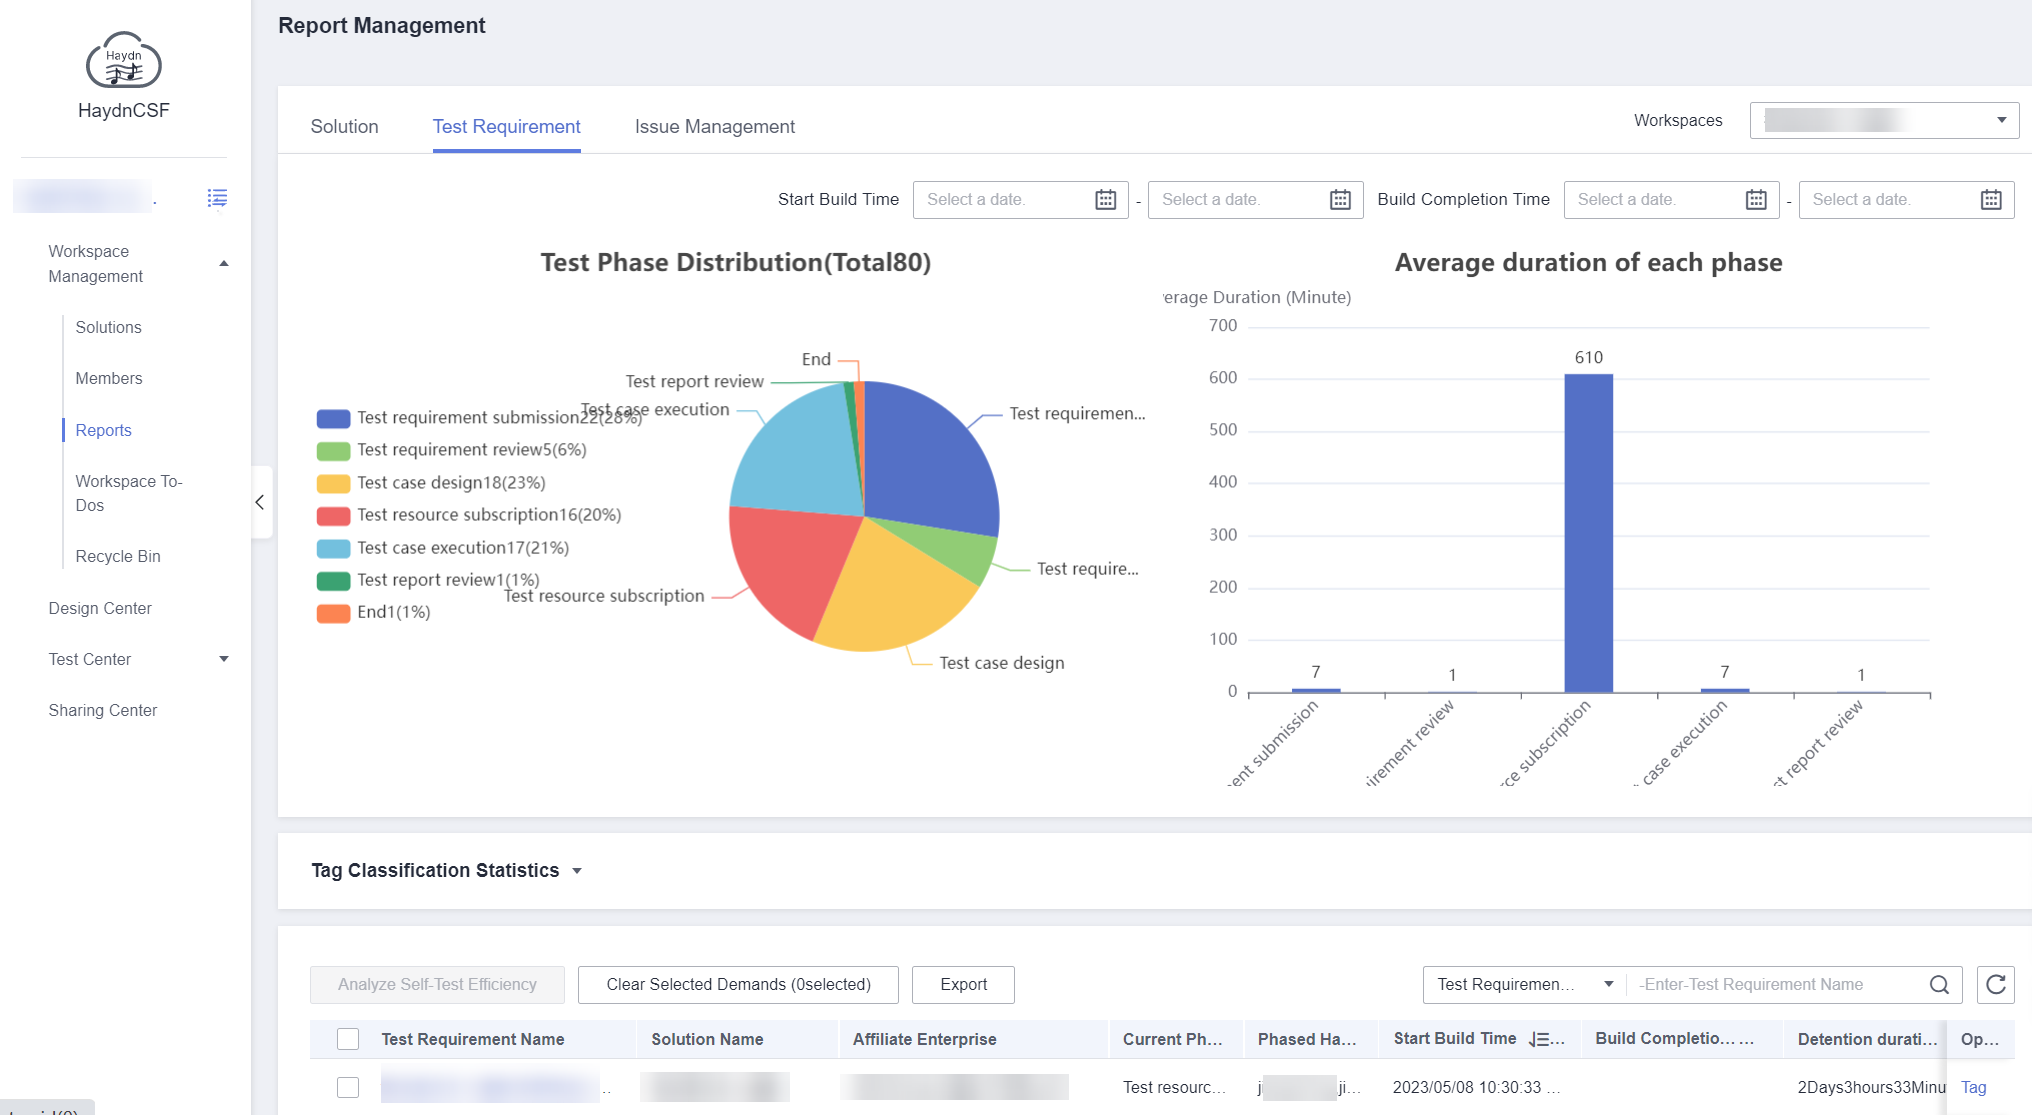
- Test requirement list: You can view the test requirement name and solution name, manage labels for requirement tags, and analyze self-test efficiency.
- Tag management: Manage requirements by user-defined tag. Locate the test requirement and click Tag in the Operation column. In the displayed dialog box, enter or select a tag, and click OK.
- Self-test efficiency analysis: Select the requirements to be analyzed and click Analyze Self-Test Efficiency to view the average solution building duration and average self-test rate.
Average solution building duration: average building verification duration of a selected solution. Average self-test rate: average self-test rate of the requirements associated with the selected solution.
Figure 3 Entry for self-test efficiency analysis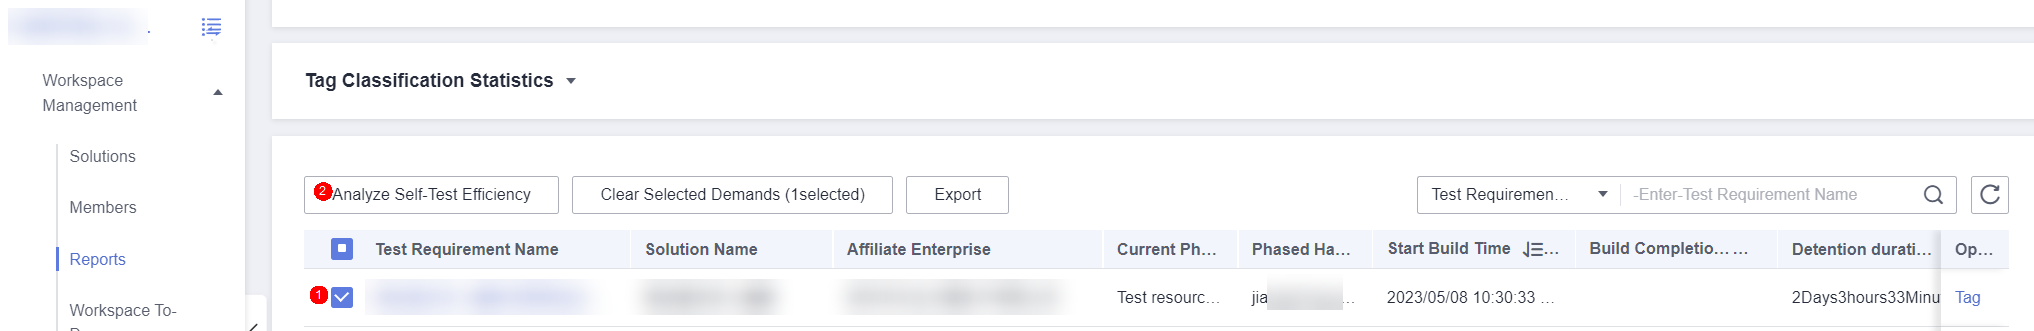 Figure 4 Average self-test rate
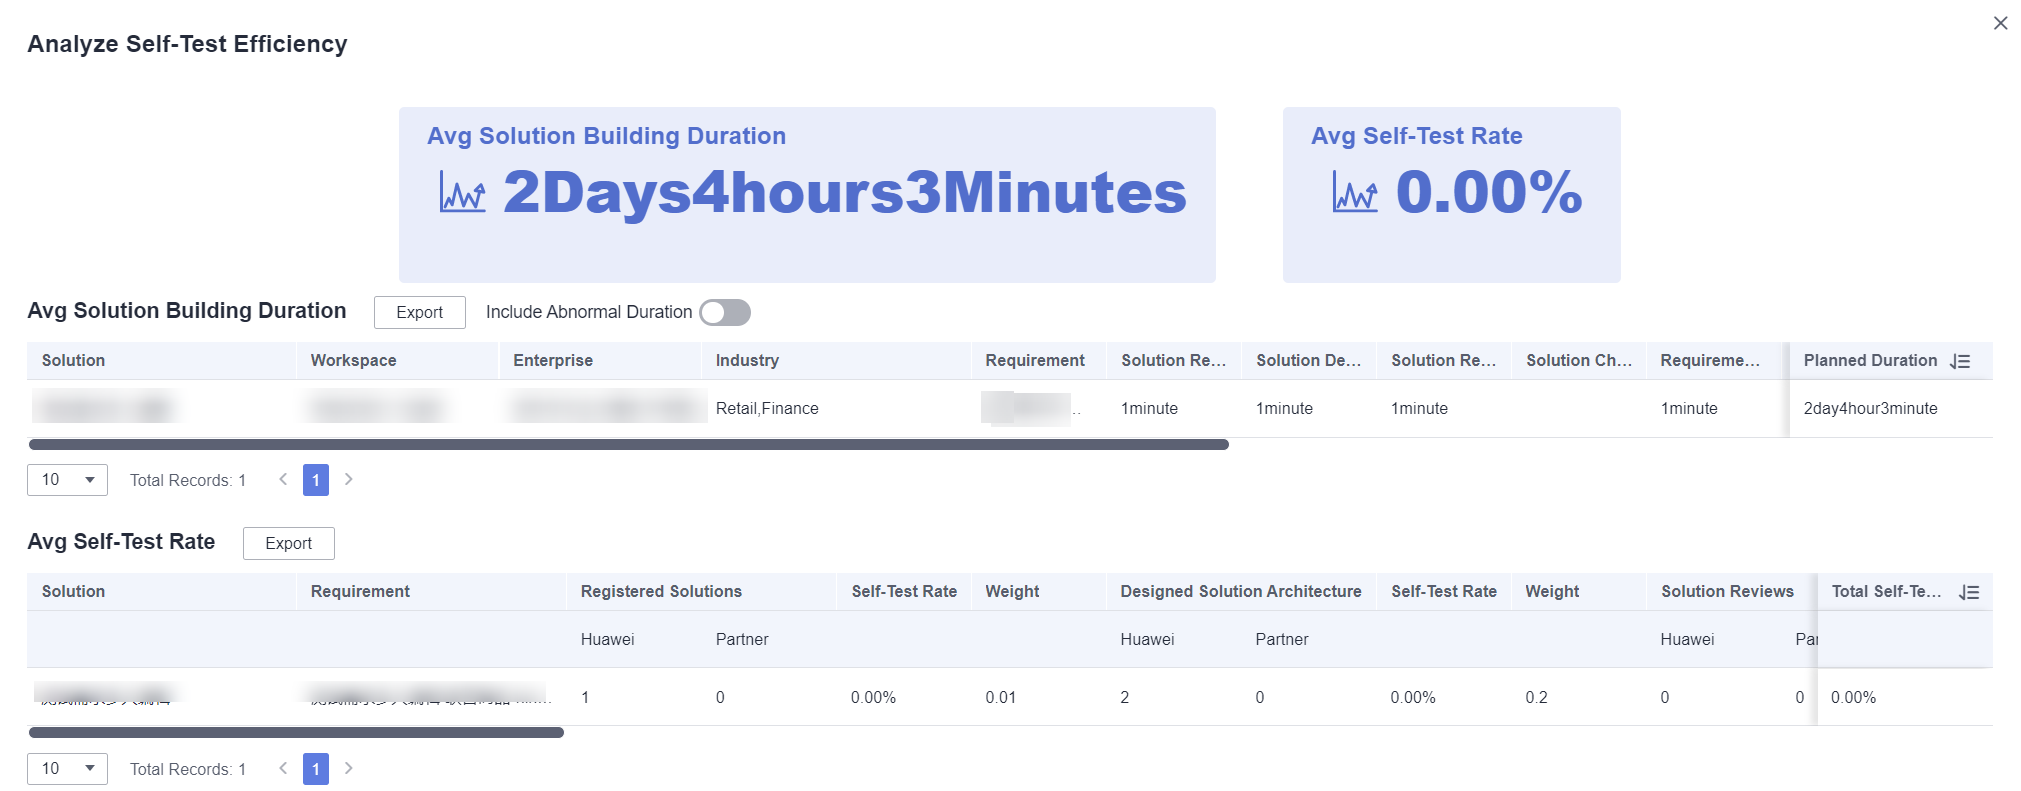
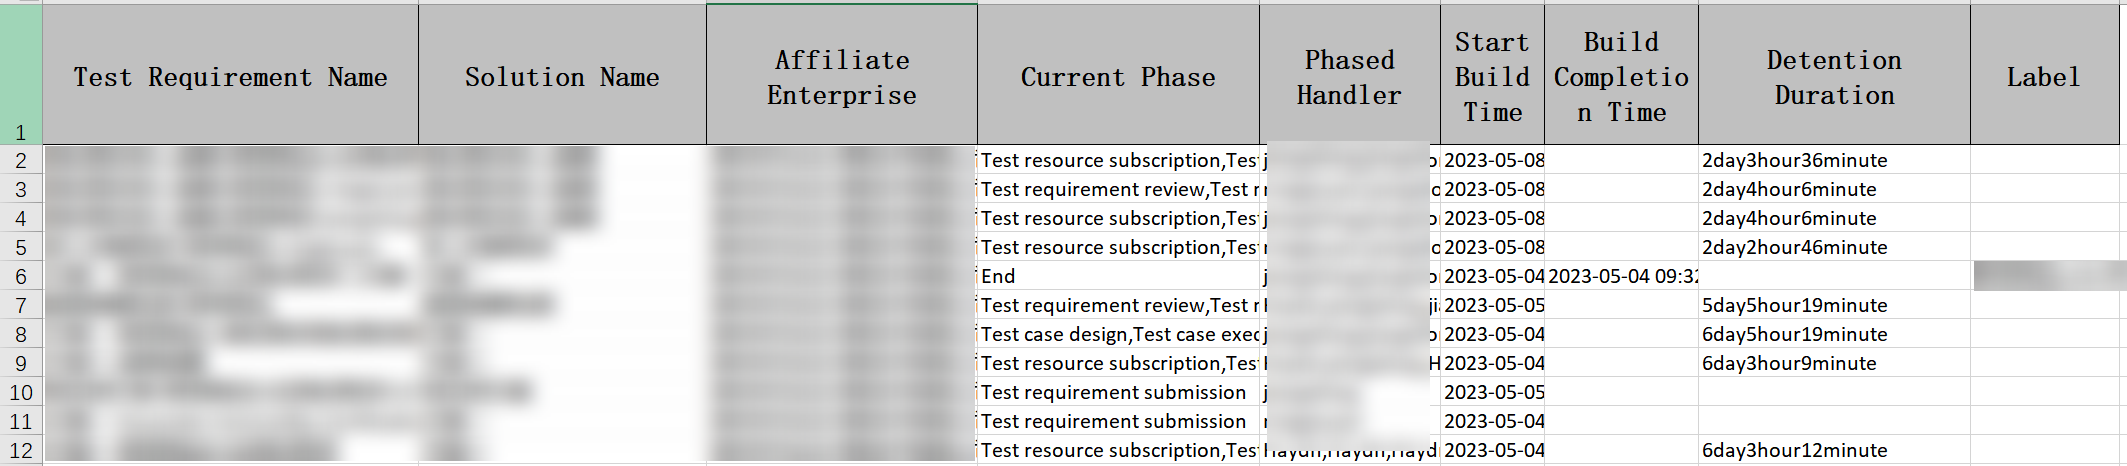
- Requirement exporting: Select a test requirement and click Export above the requirement list.
Figure 5 Requirements displayed in an .xlsx file
Issue report page
The Issues page consists of four areas: test requirement distribution pie chart, associated cloud service distribution pie chart, issue closure status pie chart, and issue list.
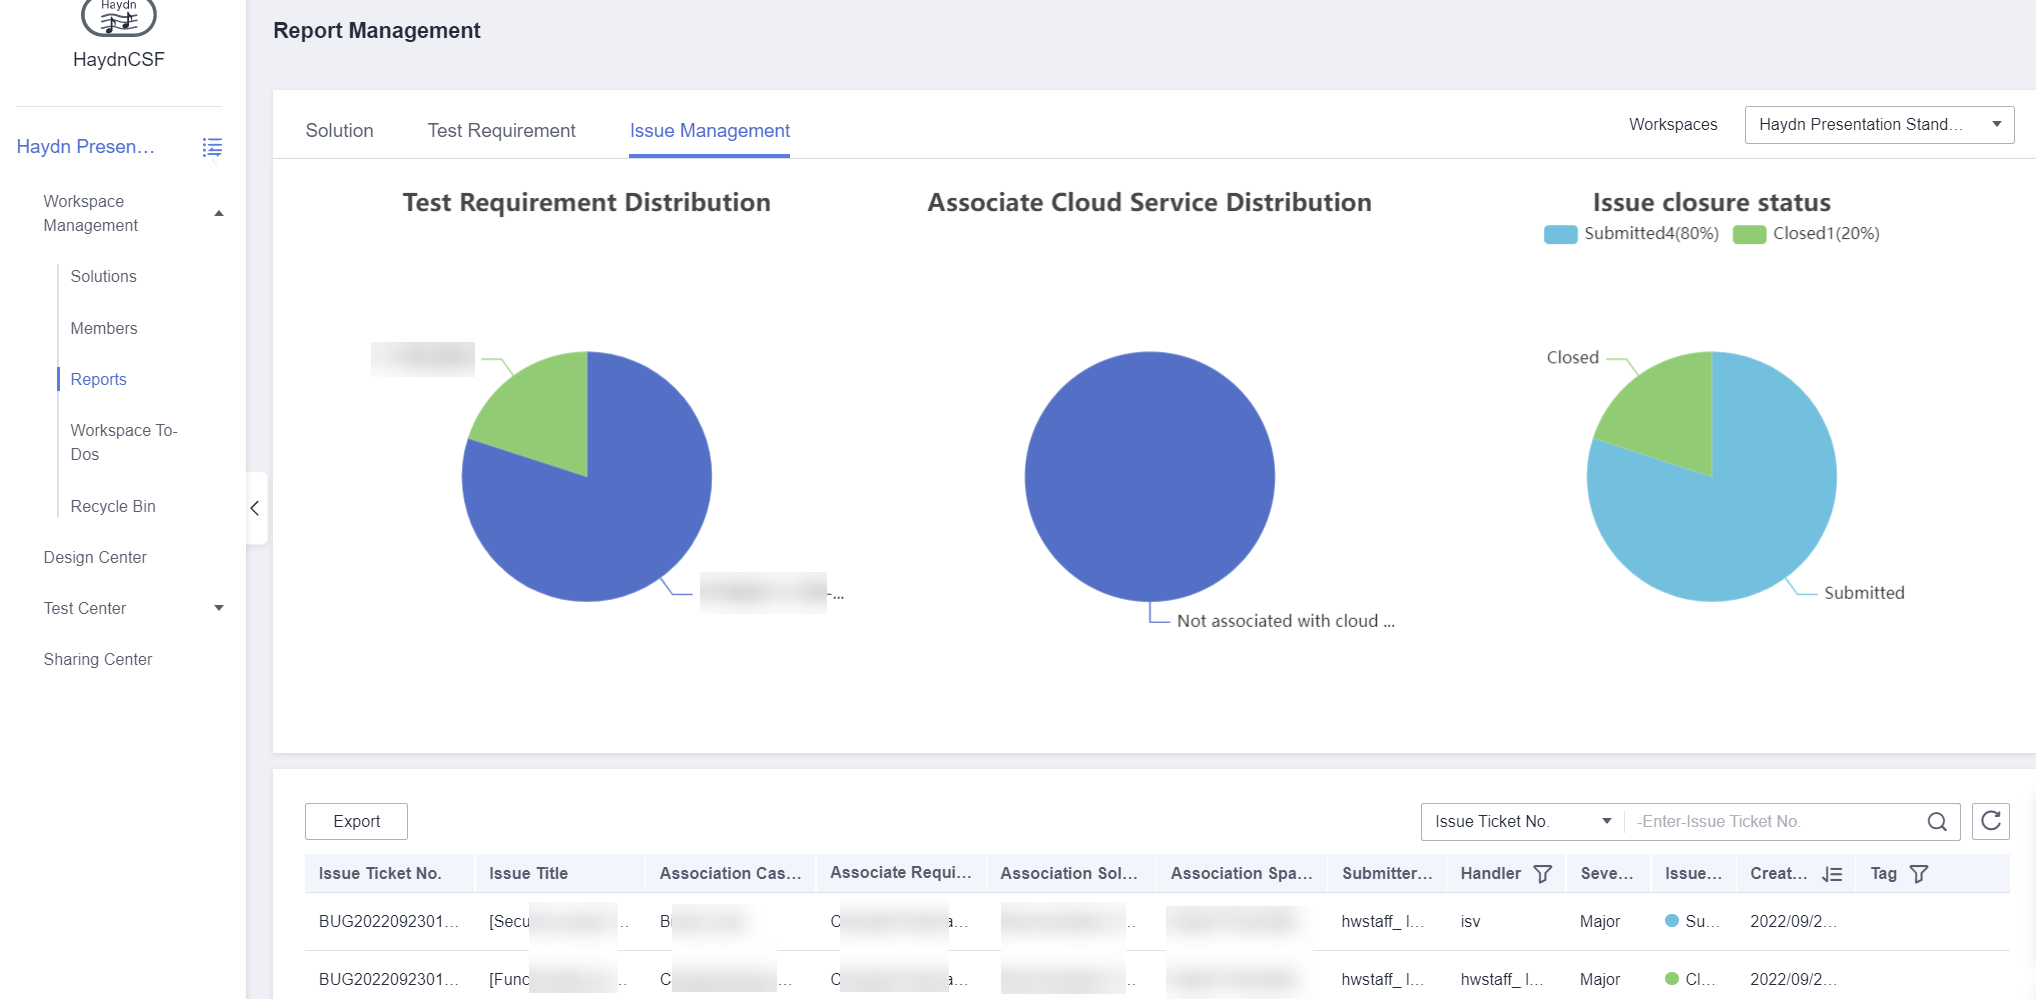
- Test requirement distribution pie chart: All the requirements are displayed by issue in the workspace.
- Associated cloud service distribution pie chart: Issues are displayed by cloud service in the workspace.
- Issue closure status: Verified issue tickets in the current phase in the workspace are displayed. There are five phases: submission, locating, rectification, acceptance, and closure.
- Issue list: You can view information such as the requirement associated with an issue ticket. You can search for an issue by issue ticket number or issue title.
For details about issue management, see Issue Management.
Feedback
Was this page helpful?
Provide feedbackThank you very much for your feedback. We will continue working to improve the documentation.See the reply and handling status in My Cloud VOC.
For any further questions, feel free to contact us through the chatbot.
Chatbot


