Configuring APM
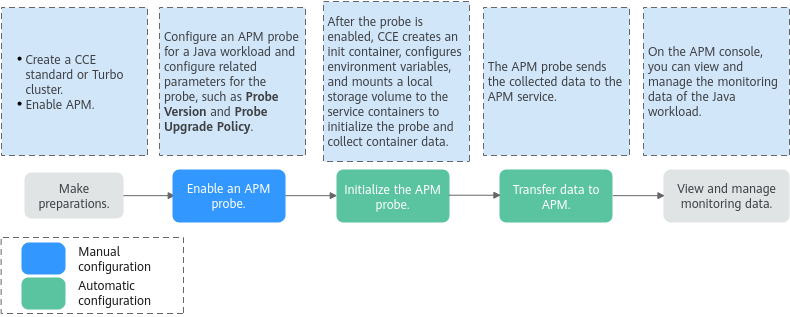
Application Performance Management (APM) monitors and manages the performance and faults of cloud applications in real time. It helps O&M personnel detect performance bottlenecks and identify fault causes, ensuring user experience. To monitor a Java workload that is deployed in a CCE standard or Turbo cluster, simply enable APM probes. There is no need to modify code. The APM probes help identify errors and slow APIs, reproduce calling parameters, and detect system bottlenecks. This greatly improves the efficiency of diagnosing online problems. Figure 1 illustrates the operational process of an APM probe. This section describes how to configure APM settings for a workload using the console.
Prerequisites
You have enabled APM. APM 1.0 will be taken offline soon. Use APM 2.0 instead. For details, see Enabling APM 2.0.
Notes and Constraints
- The APM service is only available in certain regions. APM 1.0 and APM 2.0 are available in different regions. For details, see the APM console. If the APM service is unavailable in the current region, APM settings on CCE will also be unavailable.
- Only Deployments, StatefulSets, and DaemonSets support APM settings.
Billing
APM probes are billed. For details, see Application Performance Management Price Calculator.
Configuring APM Settings
You can configure APM settings for a workload either during or after the creation.
When creating a Java workload, take the following steps to enable an APM probe to monitor the workload.
- Log in to the CCE console and click the cluster name to access the cluster console.
- In the navigation pane, choose Workloads. In the upper right corner of the displayed page, click Create Workload.
- In the Advanced Settings area, click APM Settings and enable a probe. By default, the probe is disabled. You can choose APM 1.0 or APM 2.0 as required. APM 1.0 probes are not supported on the APM console. Use an APM 2.0 probe instead.
 After an APM probe is enabled, CCE transmits Java application data to the APM service for more precise fault location and analysis. Additionally, CCE:
- Creates an init container init-pinpoint for APM 1.0 or init-javaagent for APM 2.0 to initialize the probe and allocates 0.25 CPU cores and 250 MiB of memory to the init container.
- Adds the PAAS_MONITORING_GROUP, JAVA_TOOL_OPTIONS, and PAAS_CLUSTER_ID environment variables to all service containers of the workload.
- Mounts a local storage volume paas-apm for APM 1.0 or paas-apm2 for APM 2.0 to all service containers of the workload.
- Configure probe-related parameters.
- APM 2.0
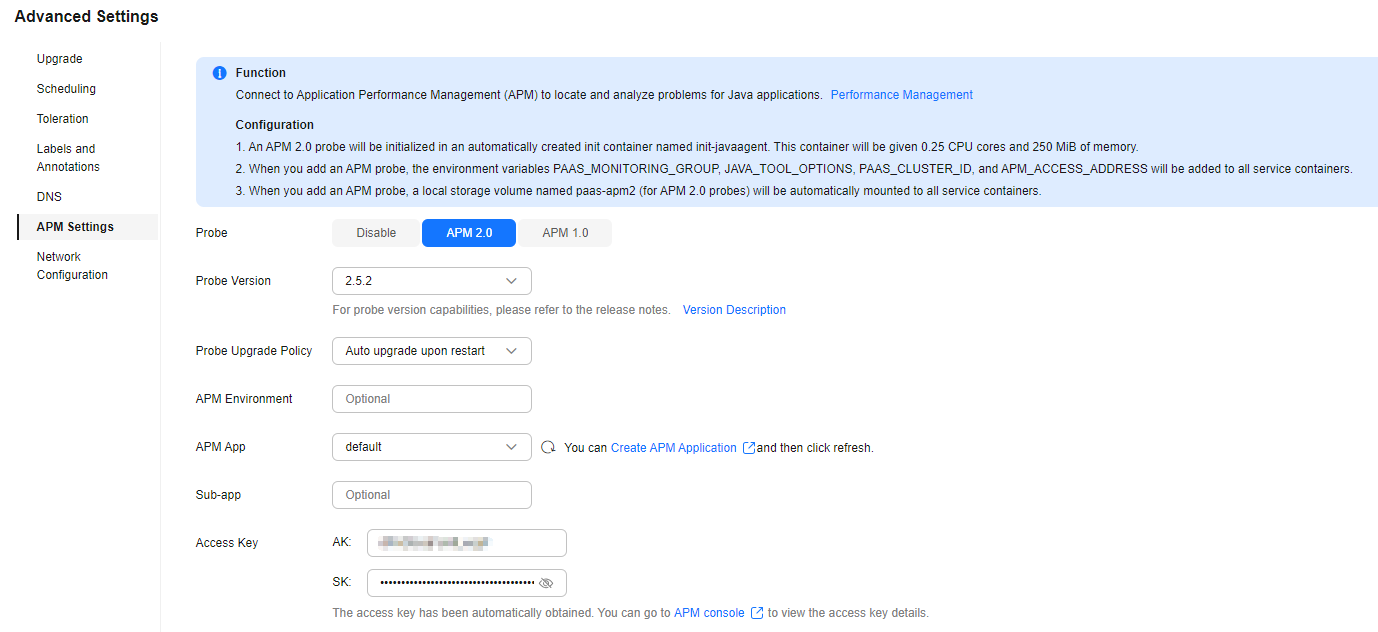
Figure 2 Enabling an APM 2.0 probe

Table 1 APM 2.0 probe parameter settings Parameter
Example Value
Description
Probe Version
2.5.2
Select a probe version as required based on the following considerations:
- The latest probe version does not necessarily correspond to the most recent version. For details about the probe capabilities of different versions, see JavaAgent Updates.
- Probes support multiple CPU architectures (such as x86 and Arm). Select a probe version matching the architecture of the node where the workload is deployed. If the probe version does not contain x86_64 or aarch64, CCE will align it with the node architecture.
Probe Upgrade Policy
Auto upgrade upon restart
Select an option to define how a probe will be upgraded. It defaults to Auto upgrade upon restart. Options include:
- Auto upgrade upon restart: The probe image is always re-downloaded when the workload restarts.
- Manual upgrade upon restart: If the probe image is available locally, the local image will be used. Otherwise, the image will be re-downloaded.
APM Environment
N/A
(Optional) Enter an environment name. APM will create an environment for the workload. APM environments help distinguish performance data across different deployment phases, such as production and testing, for classified management and precise analysis of application performance.
APM App
default
Select an existing application from APM. APM applications help organize monitoring data by function module, allowing unified management and analysis.
Sub-app
N/A
(Optional) Enter an APM sub-application name for more refined management.
If the sub-application already exists in APM, the workload will be associated with the sub-application. Otherwise, CCE will create the specified sub-application.
Access Key
AK: xxx
SK: xxx
Enter the APM AK/SK, which are used to obtain the permissions to report data. CCE will retrieve the APM AK/SK for you.
- APM 1.0
Figure 3 Enabling an APM 1.0 probe

Table 2 APM 1.0 probe parameter settings Parameter
Example Value
Description
Monitoring Group
test
Enter a monitoring group name. APM will create a monitoring group for the workload. Monitoring groups help organize monitoring data by function module, allowing unified management and analysis.
Probe Version
1.0.47
Select a probe version as required based on the following considerations:
- The latest probe version does not necessarily correspond to the most recent version. For details about the probe capabilities of different versions, see JavaAgent Updates.
- Probes support multiple CPU architectures (such as x86 and Arm). Select a probe version matching the architecture of the node where the workload is deployed. If the probe version does not contain x86_64 or aarch64, CCE will align it with the node architecture.
Probe Upgrade Policy
Auto upgrade upon restart
Select an option to define how a probe will be upgraded. It defaults to Auto upgrade upon restart. Options include:
- Auto upgrade upon restart: The probe image is always re-downloaded when the workload restarts.
- Manual upgrade upon restart: If the probe image is available locally, the local image will be used. Otherwise, the image will be re-downloaded.
- APM 2.0
- Configure other parameters and click Create Workload. After the workload status changes to Running, wait for about 3 minutes. The application data will be displayed on the APM console. Now you can log in to the APM console and optimize application performance through topologies and tracing. For details, see Application Metric Monitoring.
Take the following steps to enable an APM probe for an existing Java workload to monitor the workload.
- Log in to the CCE console and click the cluster name to access the cluster console.
- In the navigation pane, choose Workloads. In the right pane, locate the row containing the target workload on the corresponding tab. Click the name of the workload.
- On the workload details page, click the APM Settings tab. In the Probe area, click Edit on the right.
- Select APM 1.0 or APM 2.0. By default, the probe is disabled. APM 1.0 probes are not supported on the APM console. Use an APM 2.0 probe instead.
 After an APM probe is enabled, CCE transmits Java application data to the APM service for more precise fault location and analysis. Additionally, CCE:
- Creates an init container init-pinpoint for APM 1.0 or init-javaagent for APM 2.0 to initialize the probe and allocates 0.25 CPU cores and 250 MiB of memory to the init container.
- Adds the PAAS_MONITORING_GROUP, JAVA_TOOL_OPTIONS, and PAAS_CLUSTER_ID environment variables to all service containers of the workload.
- Mounts a local storage volume paas-apm for APM 1.0 or paas-apm2 for APM 2.0 to all service containers of the workload.
- Configure probe-related parameters.
- APM 2.0
Figure 4 Enabling an APM 2.0 probe

Table 3 APM 2.0 probe parameter settings Parameter
Example Value
Description
Probe Version
2.5.2
Select a probe version as required based on the following considerations:
- The latest probe version does not necessarily correspond to the most recent version. For details about the probe capabilities of different versions, see JavaAgent Updates.
- Probes support multiple CPU architectures (such as x86 and Arm). Select a probe version matching the architecture of the node where the workload is deployed. If the probe version does not contain x86_64 or aarch64, CCE will align it with the node architecture.
Probe Upgrade Policy
Auto upgrade upon restart
Select an option to define how a probe will be upgraded. It defaults to Auto upgrade upon restart. Options include:
- Auto upgrade upon restart: The probe image is always re-downloaded when the workload restarts.
- Manual upgrade upon restart: If the probe image is available locally, the local image will be used. Otherwise, the image will be re-downloaded.
APM Environment
N/A
(Optional) Enter an environment name. APM will create an environment for the workload. APM environments help distinguish performance data across different deployment phases, such as production and testing, for classified management and precise analysis of application performance.
APM App
default
Select an existing application from APM. APM applications help organize monitoring data by function module, allowing unified management and analysis.
Sub-app
N/A
(Optional) Enter an APM sub-application name for more refined management.
If the sub-application already exists in APM, the workload will be associated with the sub-application. Otherwise, CCE will create the specified sub-application.
Access Key
AK: xxx
SK: xxx
Enter the APM AK/SK, which are used to obtain the permissions to report data. CCE will retrieve the APM AK/SK for you.
- APM 1.0
Figure 5 Enabling an APM 1.0 probe

Table 4 APM 1.0 probe parameter settings Parameter
Example Value
Description
Monitoring Group
test
Enter a monitoring group name. APM will create a monitoring group for the workload. Monitoring groups help organize monitoring data by function module, allowing unified management and analysis.
Probe Version
1.0.47
Select a probe version as required based on the following considerations:
- The latest probe version does not necessarily correspond to the most recent version. For details about the probe capabilities of different versions, see JavaAgent Updates.
- Probes support multiple CPU architectures (such as x86 and Arm). Select a probe version matching the architecture of the node where the workload is deployed. If the probe version does not contain x86_64 or aarch64, CCE will align it with the node architecture.
Probe Upgrade Policy
Auto upgrade upon restart
Select an option to define how a probe will be upgraded. It defaults to Auto upgrade upon restart. Options include:
- Auto upgrade upon restart: The probe image is always re-downloaded when the workload restarts.
- Manual upgrade upon restart: If the probe image is available locally, the local image will be used. Otherwise, the image will be re-downloaded.
- APM 2.0
- After completing the configuration, click OK in the lower right corner. After the workload status changes to Running, wait for about 3 minutes. The application data will be displayed on the APM console. Now you can log in to the APM console and optimize application performance through topologies and tracing. For details, see Application Metric Monitoring.
Modifying APM Settings
After enabling an APM probe, you can modify the probe settings.
- Log in to the CCE console and click the cluster name to access the cluster console.
- In the navigation pane, choose Workloads. In the right pane, locate the row containing the target workload on the corresponding tab. Click the name of the workload.
- On the workload details page, click the APM Settings tab. In the Probe area, click Edit on the right.
- Modify the APM probe parameters as required.
- APM 2.0
Figure 6 Enabling an APM 2.0 probe

Table 5 APM 2.0 probe parameter settings Parameter
Example Value
Description
Probe Version
2.5.2
Select a probe version as required based on the following considerations:
- The latest probe version does not necessarily correspond to the most recent version. For details about the probe capabilities of different versions, see JavaAgent Updates.
- Probes support multiple CPU architectures (such as x86 and Arm). Select a probe version matching the architecture of the node where the workload is deployed. If the probe version does not contain x86_64 or aarch64, CCE will align it with the node architecture.
Probe Upgrade Policy
Auto upgrade upon restart
Select an option to define how a probe will be upgraded. It defaults to Auto upgrade upon restart. Options include:
- Auto upgrade upon restart: The probe image is always re-downloaded when the workload restarts.
- Manual upgrade upon restart: If the probe image is available locally, the local image will be used. Otherwise, the image will be re-downloaded.
APM Environment
N/A
(Optional) Enter an environment name. APM will create an environment for the workload. APM environments help distinguish performance data across different deployment phases, such as production and testing, for classified management and precise analysis of application performance.
APM App
default
Select an existing application from APM. APM applications help organize monitoring data by function module, allowing unified management and analysis.
Sub-app
N/A
(Optional) Enter an APM sub-application name for more refined management.
If the sub-application already exists in APM, the workload will be associated with the sub-application. Otherwise, CCE will create the specified sub-application.
Access Key
AK: xxx
SK: xxx
Enter the APM AK/SK, which are used to obtain the permissions to report data. CCE will retrieve the APM AK/SK for you.
- APM 1.0
Figure 7 Enabling an APM 1.0 probe

Table 6 APM 1.0 probe parameter settings Parameter
Example Value
Description
Monitoring Group
test
Enter a monitoring group name. APM will create a monitoring group for the workload. Monitoring groups help organize monitoring data by function module, allowing unified management and analysis.
Probe Version
1.0.47
Select a probe version as required based on the following considerations:
- The latest probe version does not necessarily correspond to the most recent version. For details about the probe capabilities of different versions, see JavaAgent Updates.
- Probes support multiple CPU architectures (such as x86 and Arm). Select a probe version matching the architecture of the node where the workload is deployed. If the probe version does not contain x86_64 or aarch64, CCE will align it with the node architecture.
Probe Upgrade Policy
Auto upgrade upon restart
Select an option to define how a probe will be upgraded. It defaults to Auto upgrade upon restart. Options include:
- Auto upgrade upon restart: The probe image is always re-downloaded when the workload restarts.
- Manual upgrade upon restart: If the probe image is available locally, the local image will be used. Otherwise, the image will be re-downloaded.
- APM 2.0
- After completing the configuration, click OK in the lower right corner. After the workload status changes to Running, APM will update the settings, which takes about 3 minutes.
Helpful Links
- To learn more about workload parameters, see Creating a Workload.
- After a workload is created, you can upgrade it, edit its YAML file, view its logs, and perform other operations on it. For details, see Managing Workloads.
- If a workload fails to be created, rectify the fault by referring to Workload Exception Troubleshooting.
- After configuring APM probes for workloads, you can monitor and manage data on APM and optimize the application performance through topologies and tracing. For details, see Before You Start.
Feedback
Was this page helpful?
Provide feedbackThank you very much for your feedback. We will continue working to improve the documentation.See the reply and handling status in My Cloud VOC.
For any further questions, feel free to contact us through the chatbot.
Chatbot


