
Widget Data Access
Widget Interconnection Data Configuration Switch
Widget data can be obtained from static data or datasets. Take the EchartsWidgetTemplate widget as an example. You can configure the widget access data in the {Widget}.editor.js file. If the propertiesConfig widget contains a configuration item of the dataSetting type, the widget needs to connect to the dataset by default. The following shows an example configuration:
{
      type: 'dataSetting',
      mapping: {
        x: {
          keyName: 'dataX',
          keyTitle: { zh_CN: 'X axis Data', en_US: 'X axis Data' },
          limitNumber: '1',
          type: 'category',
          label: 'x',
          required: true,
        },
        y: {
          keyName: 'value',
          keyTitle: { zh_CN: 'Y axis Data', en_US: 'Y axis Data' },
          limitNumber: '1',
          type: 'value',
          label: 'y',
          required: true,
        },
        s: {
          label: 's',
          limitNumber: '1',
          series: [
            {
              type: '',
              label: '',
              required: false,
            },
          ],
        },
      },
      mock: {},
      name: 'EchartsWidgetTemplateConnector',
      model: 'CommonViewModel',
},
|
Field |
Type |
Mandatory or Not |
Example |
Description |
|---|---|---|---|---|
|
type |
String |
Yes |
type: "dataSetting" |
dataSetting indicates the dataset type. |
|
mapping |
Object |
No |
Configuration item for dragging dataset data. |
|
|
name |
String |
Yes |
EchartsWidgetTemplateConnector |
Unique ID of a database instance. |
|
Field |
Type |
Mandatory or Not |
Example |
Description |
|---|---|---|---|---|
|
type |
String |
Yes |
type: "value" |
Verify the dragged field based on the type. The value is an enumerated value.
|
|
keyTitle |
Object |
Yes |
keyTitle: { zh_CN: "X axis Data", en_US: "X axis Data" } |
Title, which needs to be internationalized. |
|
limitNumber |
String |
No |
type: '1' |
Maximum number of fields that can be dragged.
|
|
required |
Boolean |
No |
required: true |
Mandatory or not. |
Dataset Used by a Widget
- Obtain the dataset instance.
You can use the following API in the widget code to obtain the corresponding dataset instance.
ConnectorIns: thisObj.getConnectorInstanceByName('EchartsWidgetTemplateConnector') || '', - Call the dataset to obtain data.
thisObj.callFlowConn(this.ConnectorIns, {}, (res) => {
          this.dataValue = res;
          this.drawEcharts();
        });
For example, if the dmax_line dataset is called, the return value is as follows:
Figure 1 Returned value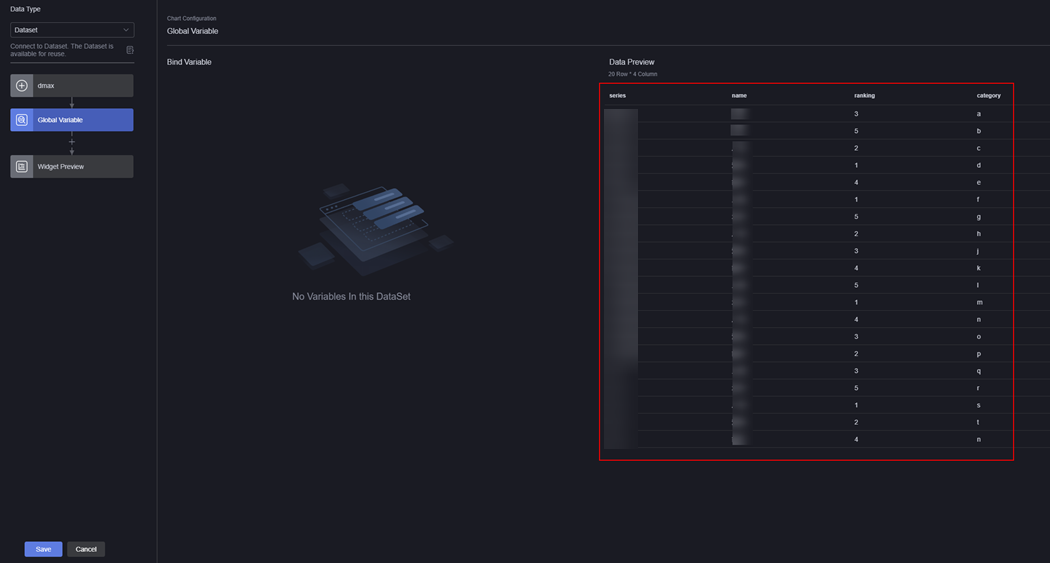
The data key values (such as name, ranking, and series) do not match the fixed fields (x, y, and s). As a result, the data cannot be rendered directly. Therefore, you need to configure the mapping, for example, map name to x, ranking to y, and series to s. This flexible mapping mechanism is called mapping.
Figure 2 Mapping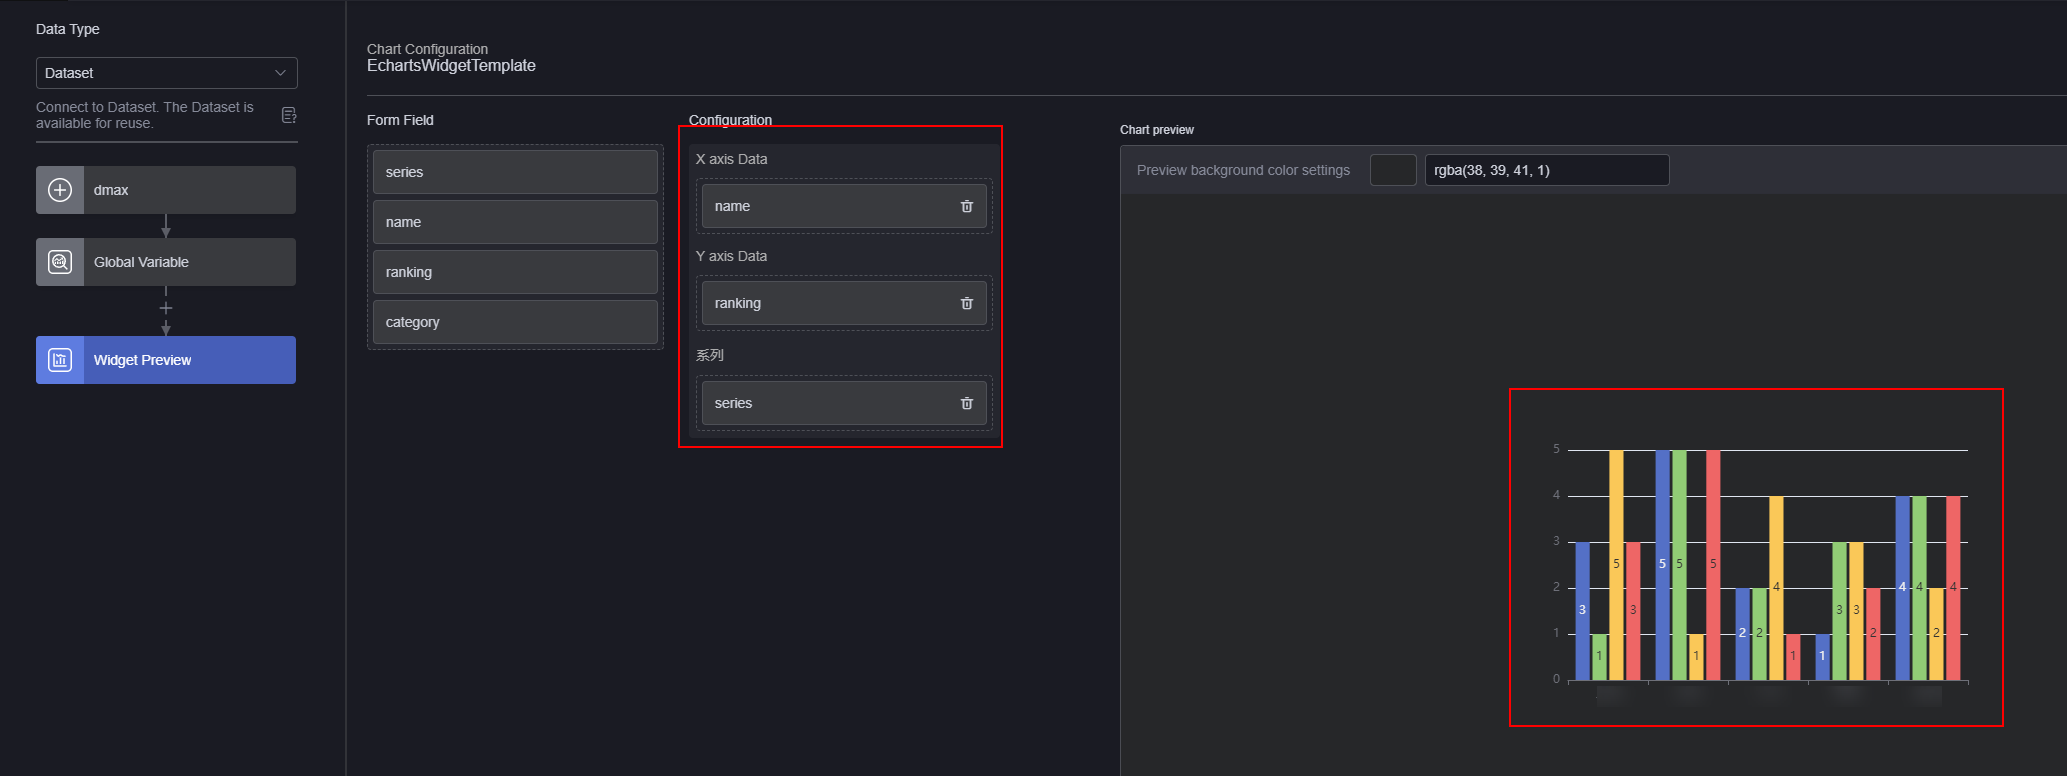
You can determine the fields to be mapped to. For example, the name field is mapped to the option tag display value field, that is, x. The ranking field is mapped to the option value field, that is, y. The series field is mapped to the option value field, that is, s.
[{
		"series": "Rainfall Amount",
		"name": "City A",
		"ranking": "3",
		"category": "a"
	},
	{
		"series": "Rainfall Amount",
		"name": "City B",
		"ranking": "5",
		"category": "b"
	}
]
Mapping result:
[{
		"s": "Rainfall Amount",
		"x": "City A",
		"y": "3",
		"category": "a"
	},
	{
		"s": "Rainfall Amount",
		"x": "City B",
		"y": "5",
		"category": "b"
	}
]
When obtaining data, the widget obtains the data that has been mapped and converted. Fixed fields such as x and y can be directly used.
Multiple Datasets
Some widgets may use multiple data sources. For example, a map widget may have multiple layers. The configuration is as follows:
 propertiesConfig: [
    {
      config: [
        {
          type: "dataSetting",
          name: 'heatMapDataConnector',
          mapping: {}
        },
        {
          type: "dataSetting",
          name: 'DistrictDataConnector',
          mapping: {}
        }
      ],
    }
  ],
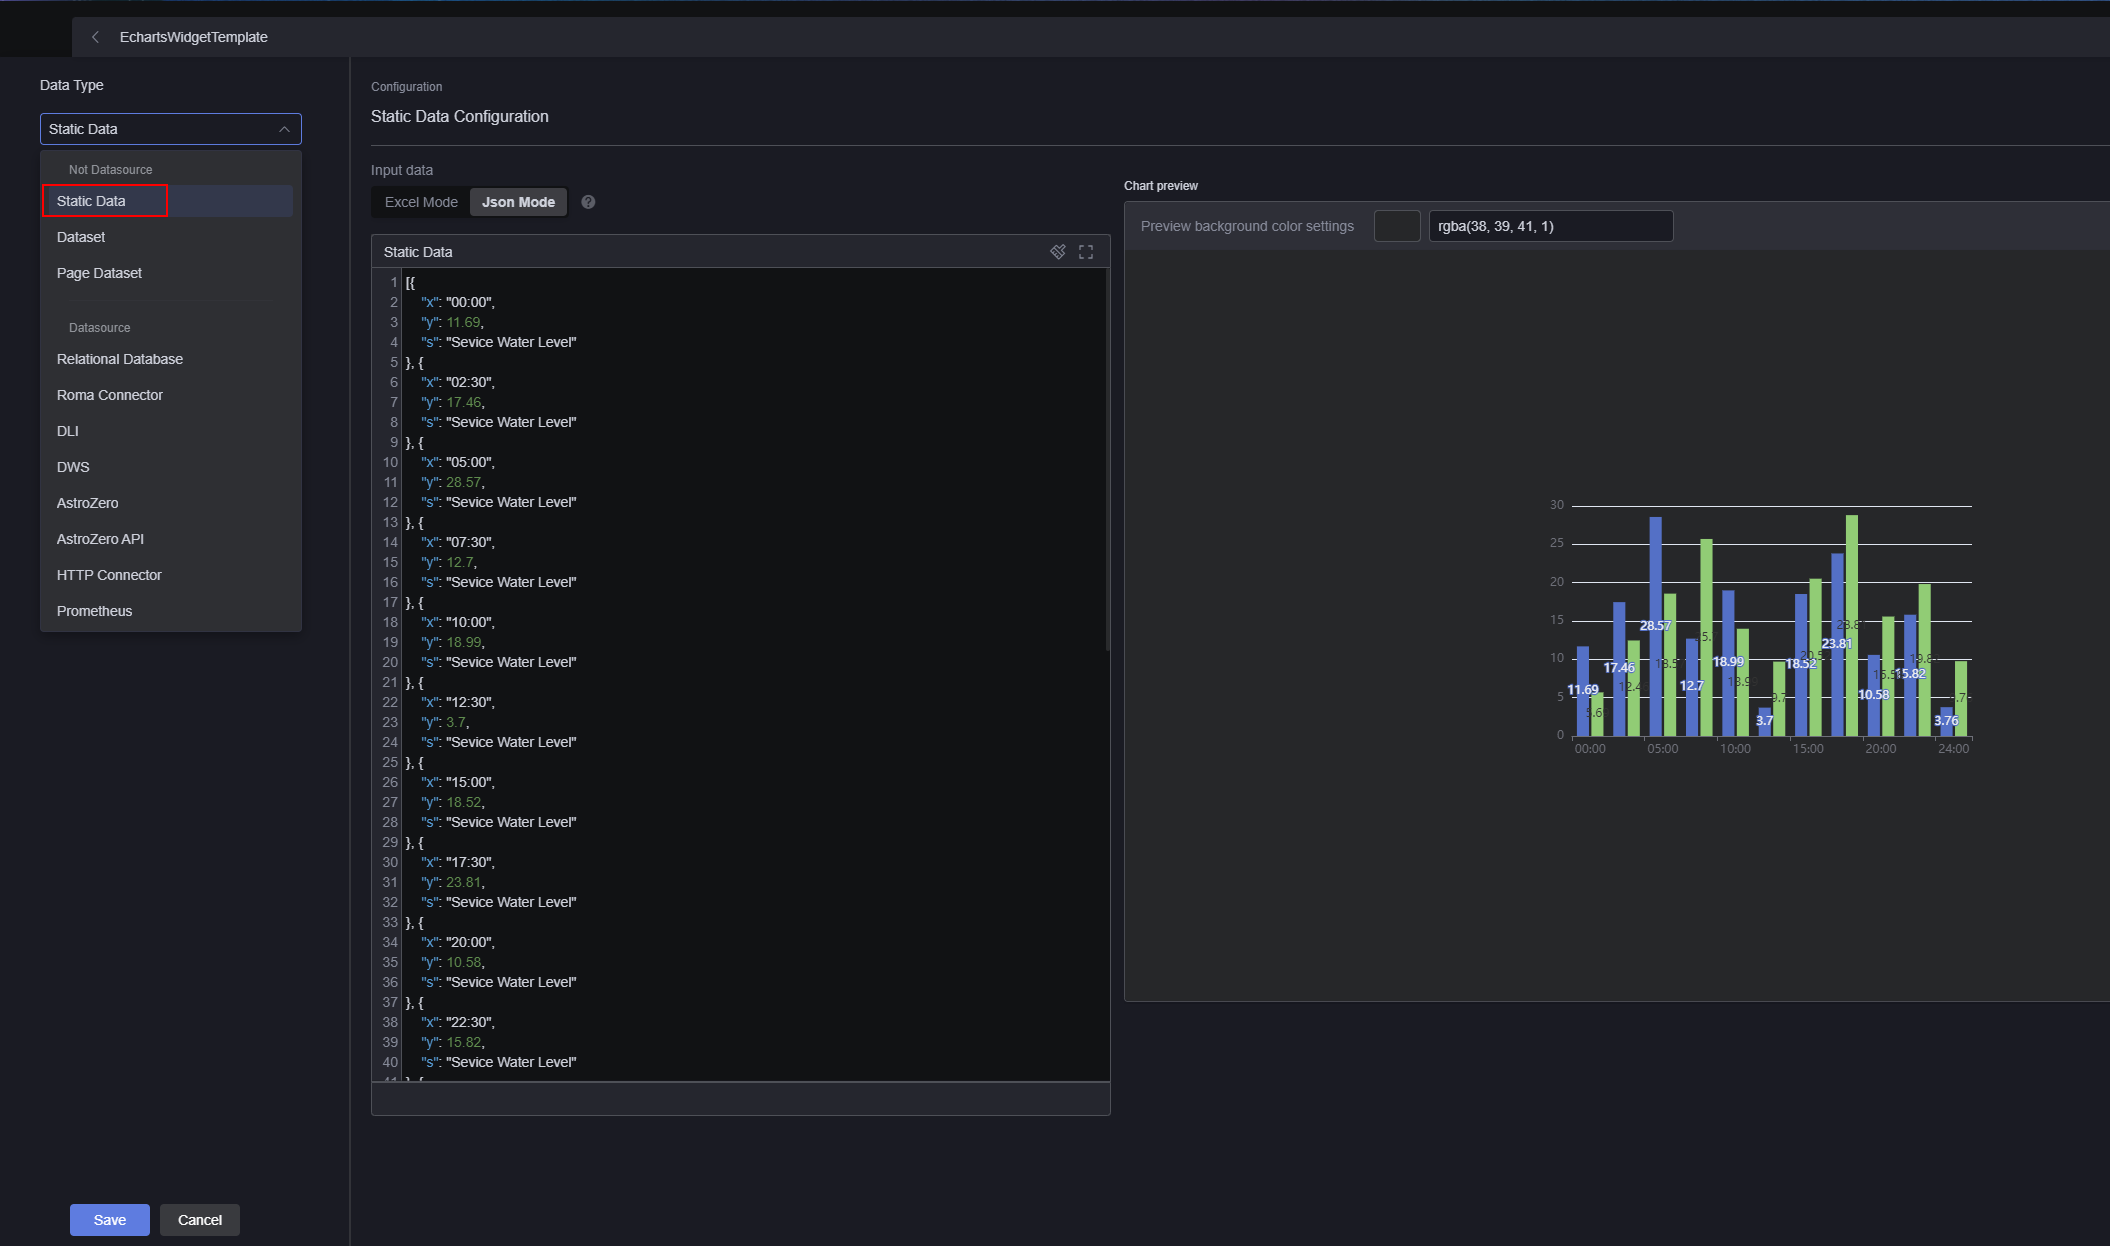
Static Data Used by A Widget
Huawei Cloud Astro Canvas calls the getMockData API defined by the widget to obtain the default static data.
getMockData() {
    const seviceWaterLevel = this.$t('setting.seviceWaterLevel');
    const seviceLoad = this.$t('setting.seviceLoad');
    return [
      {
        x: '00:00',
        y: 11.69,
        s: seviceWaterLevel,
      },
      {
        x: '02:30',
        y: 17.46,
        s: seviceWaterLevel,
      },
      {
        x: '05:00',
        y: 28.57,
        s: seviceWaterLevel,
      },
      {
        x: '07:30',
        y: 12.7,
        s: seviceWaterLevel,
      },
      {
        x: '10:00',
        y: 18.99,
        s: seviceWaterLevel,
      },
      {
        x: '12:30',
        y: 3.7,
        s: seviceWaterLevel,
      },
      {
        x: '15:00',
        y: 18.52,
        s: seviceWaterLevel,
      },
      {
        x: '17:30',
        y: 23.81,
        s: seviceWaterLevel,
      },
      {
        x: '20:00',
        y: 10.58,
        s: seviceWaterLevel,
      },
      {
        x: '22:30',
        y: 15.82,
        s: seviceWaterLevel,
      },
      {
        x: '24:00',
        y: 3.76,
        s: seviceWaterLevel,
      },
      {
        x: '00:00',
        y: 5.69,
        s: seviceLoad,
      },
      {
        x: '02:30',
        y: 12.46,
        s: seviceLoad,
      },
      {
        x: '05:00',
        y: 18.57,
        s: seviceLoad,
      },
      {
        x: '07:30',
        y: 25.7,
        s: seviceLoad,
      },
      {
        x: '10:00',
        y: 13.99,
        s: seviceLoad,
      },
      {
        x: '12:30',
        y: 9.7,
        s: seviceLoad,
      },
      {
        x: '15:00',
        y: 20.52,
        s: seviceLoad,
      },
      {
        x: '17:30',
        y: 28.81,
        s: seviceLoad,
      },
      {
        x: '20:00',
        y: 15.58,
        s: seviceLoad,
      },
      {
        x: '22:30',
        y: 19.82,
        s: seviceLoad,
      },
      {
        x: '24:00',
        y: 9.76,
        s: seviceLoad,
      },
    ];
  },
When you configure data, Static data in the following figure is static data, which can be edited online.
Feedback
Was this page helpful?
Provide feedbackThank you very much for your feedback. We will continue working to improve the documentation.See the reply and handling status in My Cloud VOC.
For any further questions, feel free to contact us through the chatbot.
Chatbot


