Quickly Building Server Monitoring Capabilities
Scenarios
In the actual O&M process of cloud computing, server monitoring is of great importance. To better monitoring servers, you can install the Agent on cloud servers created from Huawei Cloud public images. Then, you can view visualized server monitoring data and configure alarms for key service metrics. This section uses an ECS as an example to describe how to set alarm rules for CPU usage.
Procedure
|
Procedure |
Description |
|---|---|
|
Purchase an ECS. Check that the ECS is displayed in the server monitoring list on Cloud Eye. |
|
|
Install the Agent on the ECS to report monitoring metrics. |
|
|
View key metric data. |
|
|
Set custom alarm rules for specific monitoring metrics. |
|
|
When an alarm condition is met, Cloud Eye invokes SMN APIs to send notifications. You can also view the alarm information in alarm records. |
|
|
Create a masking rule to mask alarm notifications if needed. |
Preparations
Purchase an ECS. Ensure that this ECS is displayed in the server monitoring list on Cloud Eye.
Step 1: Install the Agent on the ECS
Both basic monitoring metrics and OS monitoring metrics of the ECS will be reported. Basic ECS monitoring metrics are collected every 5 minutes and reported by the ECS. OS monitoring metrics are reported only after the Agent is installed on the ECS. These metrics are reported by Cloud Eye every one minute and provide more accurate details. Moreover, the monitoring is more comprehensive, so you are advised to install the Agent on your ECSs.
The following describes how to install the Agent.
The Agent installation method depends on the OS.
For a Windows ECS, you can only install the Agent manually. There are two methods for you to find the installation instructions.
- On the Server Monitoring page of the Cloud Eye console, locate an ECS and click Install Manually to view the instructions. Then, log in to the ECS and install the Agent.
Figure 1 Agent installation guide

- Refer to the official document to install the Agent.
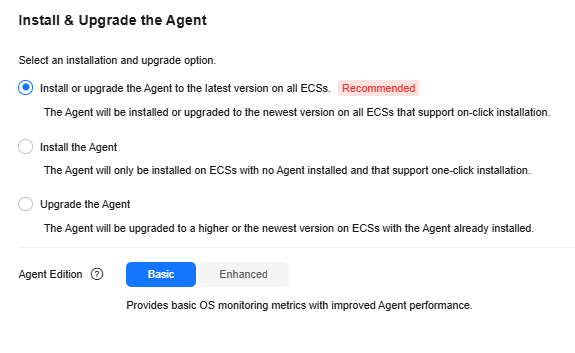
You can install the Agent on one or more Linux ECSs at a time.
- For ECSs that support one-click installation, you can batch install the Agents for them on the console, which is more efficient.
Figure 2 Installing and upgrading the Agent

- For certain ECSs, you can enable Cloud Eye monitoring when you purchase them. The Agent will be installed automatically. For details, see Purchasing and Using a Linux ECS.
Figure 3 Enabling detailed monitoring

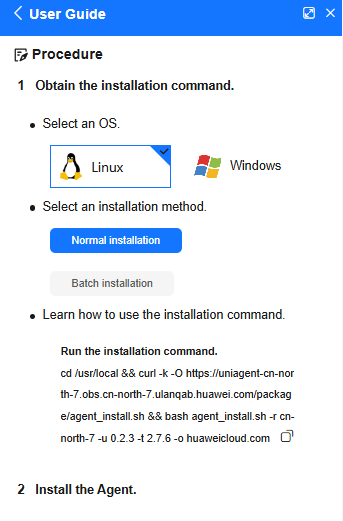
- For Linux ECSs that do not support one-click installation, you can manually install the Agents for them one by one or in batches. After you click Install Manually above the server list, the installation guide will be displayed.
Figure 4 Agent installation guide

After the Agent is installed, you can view it in the server monitoring list. If the Agent Status of an ECS is Running, the Agent is installed for the ECS.

Step 2: View ECS Monitoring Metrics
- Log in to the management console.
- In the upper left corner, select a region and project.
- Choose Service List > Cloud Eye.
- In the navigation pane, choose Server Monitoring > Elastic Cloud Server.
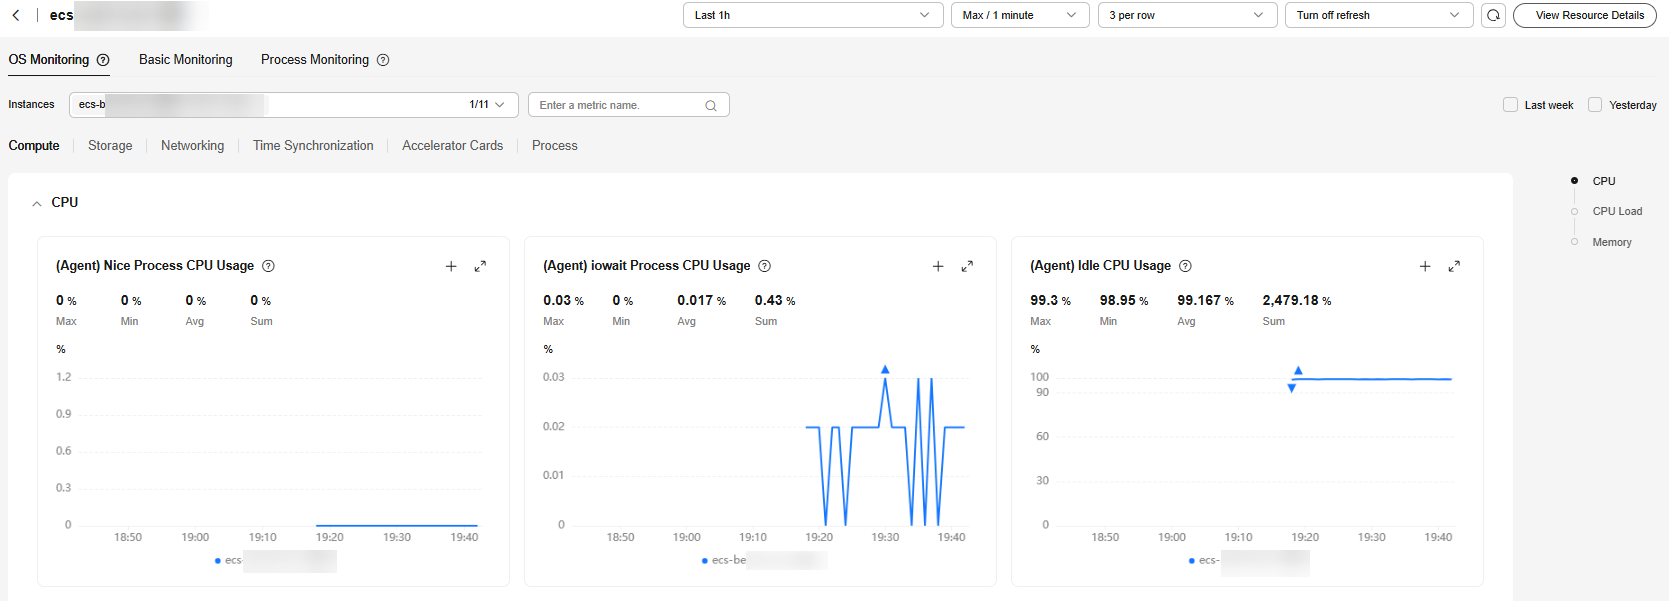
- Locate the target ECS and click View Metric in the Operation column to view the OS monitoring metrics, basic monitoring metrics, and process monitoring metrics.
Figure 6 OS monitoring

The OS monitoring and basic monitoring metrics are displayed on the metric details page. OS monitoring requires that the Agent be installed. If no OS monitoring metrics are displayed, install the Agent first.
Step 3: Create an Alarm Rule to Monitor an ECS
After purchasing an ECS, you can configure an alarm rule to monitor key service metrics of the ECS.
Cloud Eye provides a quick entry for creating alarm rules to monitor ECS or BMS metrics. This step describes how to set parameters for creating an alarm rule. For more information, see Creating an Alarm Rule to Monitor a Server.
- On the Server Monitoring page, locate an ECS and choose More > Create Alarm Rule in the Operation column.
Figure 7 Creating an alarm rule

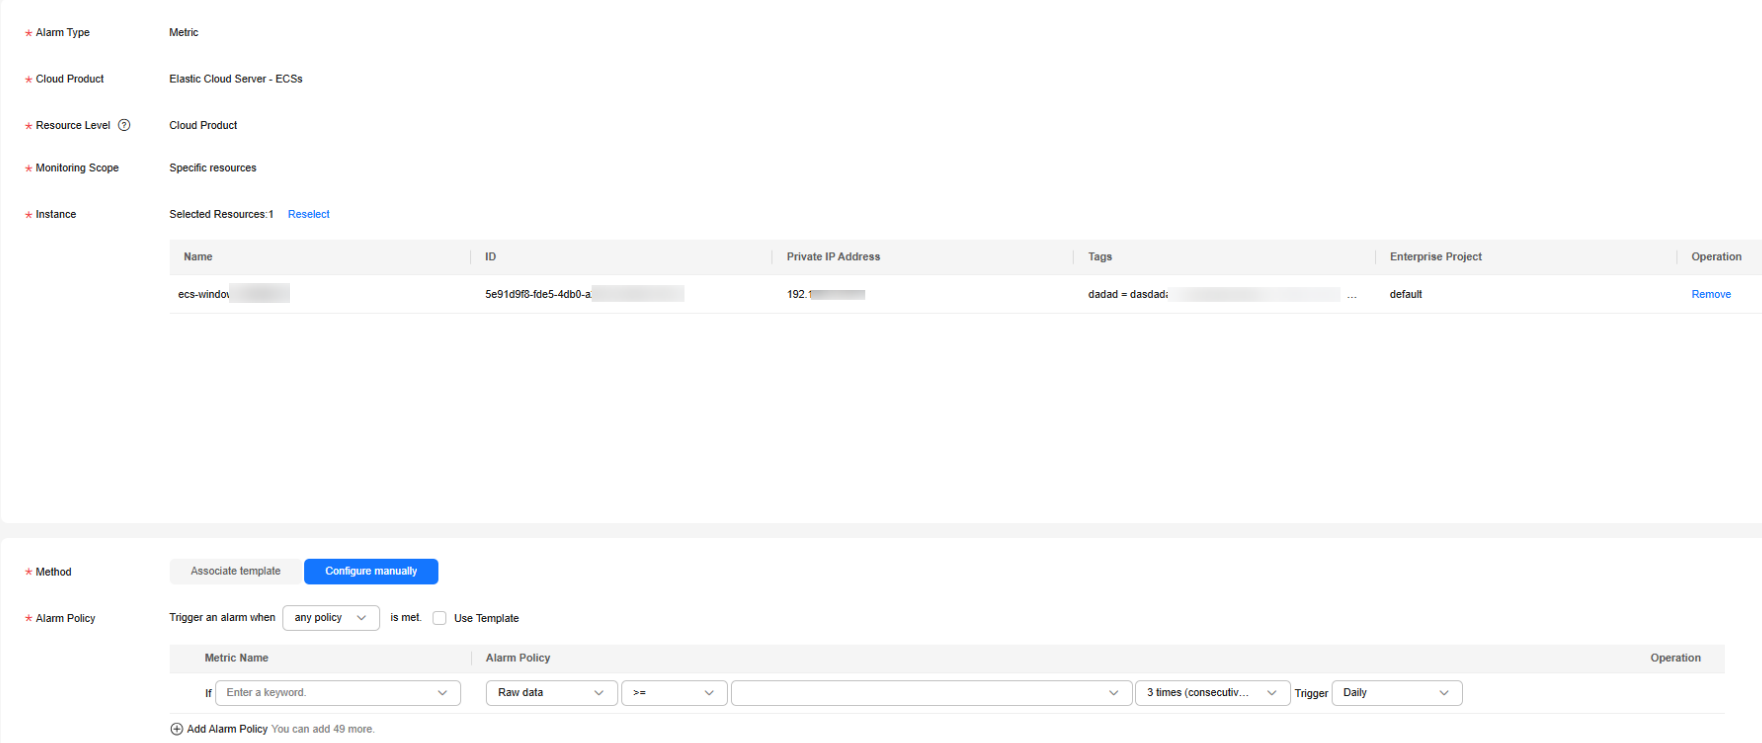
- Set parameters. The alarm type, cloud product, resource level, monitoring scope, and monitored instance are preset.
Figure 8 Creating an alarm rule to monitor a server

Table 1 Parameters for configuring an alarm rule for an ECS Parameter
Example Value
Description
Alarm Type
Metric
Alarm type that the alarm rule applies to. The value cannot be changed.
Cloud Product
Elastic Cloud Server - ECSs
Name of the service for which the alarm rule is configured. The value cannot be changed.
Resource Level
Cloud product
A cloud product has many specific dimensions. If you set Resource Level to Cloud product, metrics across dimensions can be configured in the same alarm rule. If you set it to Specific dimension, only metrics of the specified dimension can be configured in the same alarm rule
The value cannot be changed.
Monitoring Scope
Specific resources
Monitoring scope the alarm rule applies to.
Method
Configure manually
Select a rule triggering method.
Metric Name
ECSs - Process - ProcessIDs / (Agent)Process CPU Usage
Select a metric for triggering alarms.
Alarm Policy
If the metric value is greater than or equal to 80% for three consecutive times, an alarm is generated once every day.
Policy for triggering an alarm.NOTE:If the alarm is not cleared after it is generated, an alarm is reported every day.
Alarm Severity
Major
Severity of alarms.
- Configure alarm notifications. For details, see Creating an Alarm Rule and Notifications.
Table 2 Parameters for configuring alarm notifications Parameter
Example Value
Description
Alarm Notifications
Enabled
Whether to send an alarm notification when an alarm is triggered.
Notified By
Topic subscriptions
Select an alarm notification mode.
Recipient
Account contact
- If you select Topic subscriptions for Notified By, select one or more notification recipients.
- If Recipient is set to Account contact, notifications will be sent to the registered phone number and email address.
Notification Window
00:00–23:59
- If Notified By is set to Topic subscriptions, you need to set the notification window.
- Cloud Eye sends notifications only within the specified time period.
Trigger Condition
Generated alarm, Cleared alarm
This parameter is available when Notified By is set to Topic subscriptions or Notification groups. You can select Generated alarm, Cleared alarm, or both.
- After the configuration is complete, view the alarm rule in the alarm rule list.
Step 4: View Alarm Records
After receiving an alarm notification, you can search for the alarm in the alarm records by resource ID.

Follow-up Operation: Masking Alarm Notifications
If you do not need to receive notifications after an alarm is triggered, you can mask the alarm using a masking rule. After the masking rule is applied, only alarm records are generated.
- Log in to the management console.
- Choose Service List > Cloud Eye.
- In the navigation pane, choose Alarm Management > Alarm Rules.
- On the Alarm Rules page, locate the row containing the alarm rule to be masked, click More in the Operation column, and select Mask Alarm. In the displayed Create Alarm Masking dialog box, configure Alarm Masking Duration and click OK.
Figure 10 Masking an alarm rule

Related Information
For details about parameters for creating an alarm rule, see Creating an Alarm Rule and Notifications.
You can mask alarm notifications for a resource or some alarm policies of the resource. For details, see Creating a Masking Rule.
Cloud Eye also provides the one-click monitoring for key monitoring metrics. For details, see One-Click Monitoring.
Feedback
Was this page helpful?
Provide feedbackThank you very much for your feedback. We will continue working to improve the documentation.See the reply and handling status in My Cloud VOC.
For any further questions, feel free to contact us through the chatbot.
Chatbot


