Monitoring and Alarms
Live has been interconnected with Cloud Eye, where you can use the console or APIs to query monitoring metrics and alarm information of ingest domain names and streaming domain names.

- If you use a custom policy but do not use the system-defined permissions Live FullAccess and Live ReadOnlyAccess, you need to add the operation permission live:tenant:getTenantInformation before accessing the Live console.
- After assigning an IAM user the Live FullAccess permission, you need to assign the user the following Cloud Eye permissions to monitor metrics of Live:
- CES ReadOnlyAccess: On the Cloud Eye console, choose Cloud Service Monitoring > Live to view resource monitoring metrics of Live.
- CES FullAccess: On the Cloud Eye console, choose Cloud Service Monitoring > Live to view resource monitoring metrics of Live and perform operations.
Namespaces
SYS.Live
Monitoring Metrics
|
ID |
Name |
Description |
Value Range |
Monitored Object |
Monitoring Period of Raw Data (Minute) |
|---|---|---|---|---|---|
|
online |
Play concurrency number |
Queries the number of online users in a livestream. |
≥ 0 |
Streaming domain name |
1 |
|
bandwidth |
Play bandwidth |
Queries the bandwidth data of a streaming domain name. Unit: bit/s |
≥ 0 bits/s |
Streaming domain name |
1 |
|
play_traffic |
Play traffic |
Queries the playback traffic. Unit: bit |
≥ 0 bits |
Streaming domain name |
1 |
|
qps |
QPS |
Queries the number of queries per second. |
≥ 0 |
Streaming domain name |
1 |
|
http_4xx_proportion |
4xx status code proportion |
Queries the proportion of 4xx status codes. |
0-100% |
Streaming domain name |
1 |
|
http_5xx_proportion |
5xx status code proportion |
Queries the proportion of 5xx status codes. |
0–100% |
Streaming domain name |
1 |
|
inject_concurrency_number |
inject_concurrency_number |
Queries the number of concurrent pushed streams. |
≥ 0 |
Ingest domain name |
1 |
|
inject_bandwidth |
Inject bandwidth |
Queries the streaming bandwidth. Unit: bit/s |
≥ 0 bits/s |
Ingest domain name |
1 |
Dimensions
|
Key |
Value |
|---|---|
|
domain |
Streaming domain name and ingest domain name |
Viewing My Dashboards
You can create a dashboard.
Viewing Cloud Service Dashboards
Cloud service dashboards allow you to view cloud service monitoring data. Data of a cloud service is displayed on one monitoring dashboard. A cloud service dashboard is automatically generated and does not need to be configured.
To view cloud service dashboards, perform the following operations:
- Log in to the console.
- Choose All Services > Cloud Eye.
- In the navigation pane on the left, choose Cloud Service Monitoring.
- Click the dashboard name Live LIVE. The Details page is displayed.
- Click the Resources tab. In the Operation column of the desired resource, click View Metric. The Instances tab on the Details page is displayed.
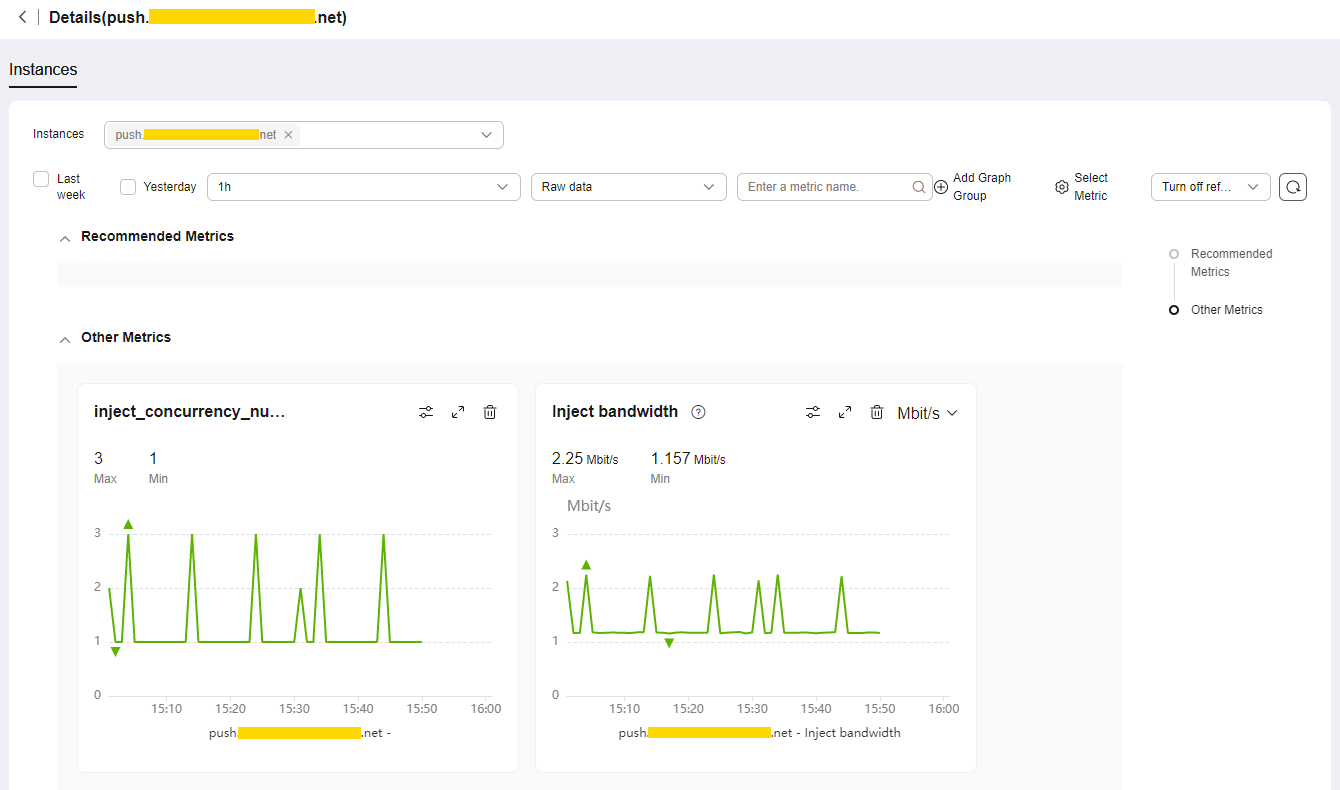
View monitoring metric details, as shown in Figure 1.
Creating an Alarm Rule
You can create an alarm rule to customize monitored objects and notification policies, so that you can be well-informed of the Live service status.
- Log in to the console.
- Choose All Services > Cloud Eye.
- In the navigation pane on the left, choose Cloud Service Monitoring.
- Click the dashboard name Live LIVE. The Details page is displayed.
- Click the Resources tab. In the Operation column of the desired resource, click More > Create Alarm Rule. The Create Alarm Rule page is displayed.
Configure parameters by referring to Creating an Alarm Rule.
- Click Create.
After the alarm rule is created, the system automatically notifies you when an alarm is triggered.
Feedback
Was this page helpful?
Provide feedbackThank you very much for your feedback. We will continue working to improve the documentation.See the reply and handling status in My Cloud VOC.
For any further questions, feel free to contact us through the chatbot.
Chatbot


