Monitoring Data
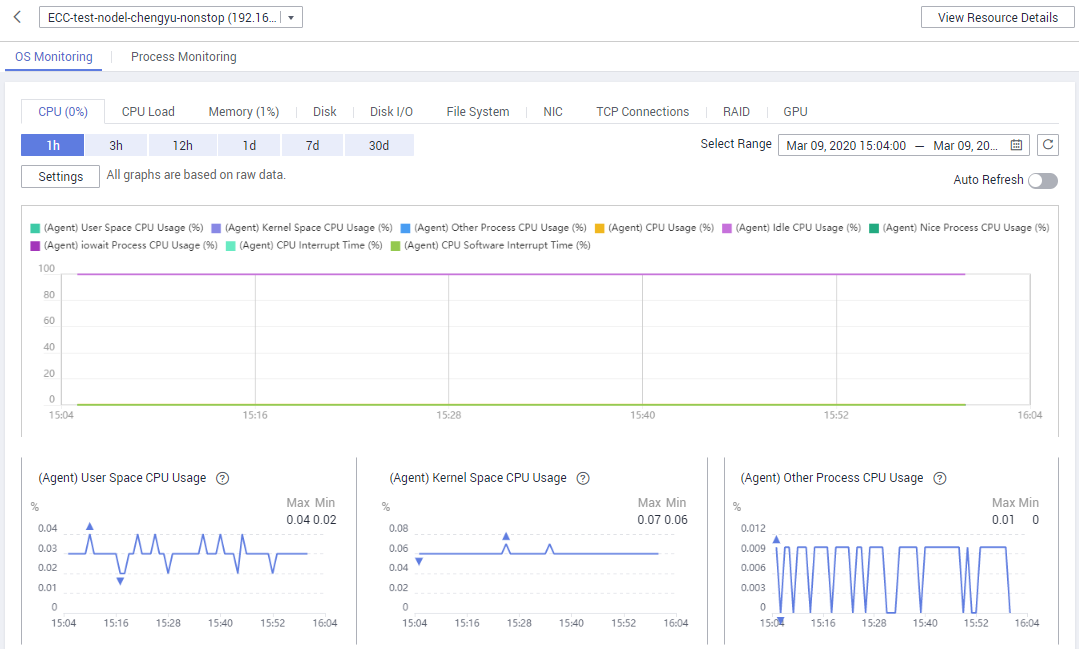
Log in to the management console and choose Cloud Eye. In the navigation pane on the left, choose Server Monitoring > Bare Metal Server. In the right pane, Name/ID, Status, and Agent Status of the BMS are displayed.

You can click View Metric in the Operation column to obtain the visualized monitoring graph of the BMS and view monitoring metrics of the BMS, such as the CPU usage, CPU load, and memory usage.

Feedback
Was this page helpful?
Provide feedbackThank you very much for your feedback. We will continue working to improve the documentation.See the reply and handling status in My Cloud VOC.
For any further questions, feel free to contact us through the chatbot.
Chatbot


