

Generating Alarms by Tag
Through Prometheus monitoring and alarm management, alarms can be generated for resources by tag. This section describes how to generate alarms for the CPU usage of a Distributed Cache Service (DCS) instance by tag.
Scenario
O&M personnel of an e-commerce platform need to manage cloud resources and generate alarms by tag.
Solution
Create Prometheus instances for cloud services and connect cloud services and tags. Then check the connected cloud service metrics and tags on the Metric Browsing page and set alarm rules for these metrics. If a metric is abnormal, an alarm will be triggered immediately and a notification will be sent.
Step 1: Add a Tag to a Cloud Service
Log in to the Tag Management Service (TMS) console and add a tag to DCS. For details, see Adding Tags to Cloud Resources.
For example, set the tag key to Ihn and the tag value to OPEN.
Step 2: Connect the Cloud Service to a Prometheus Instance
- Log in to the AOM 2.0 console.
- In the navigation pane on the left, choose Prometheus Monitoring > Instances.
- Click Add Prometheus Instance to add a common instance named prometheus_cloudservice.
- After the configuration, click OK. You can view the new common instance in the instance list.
- In the navigation pane on the left, choose Access Center > Access Center to go to the new access center.
- Select Cloud services under Types to filter the DCS card.
- Click Ingest Metric (AOM) on the DCS card. The Ingest Cloud Service Metric page is displayed.
- Instance Type: The default value is Common Prometheus instance and cannot be changed.
- Instance Name: Select prometheus_cloudservice from the instance drop-down list.
- Click Next to go to the ingestion rule configuration page.
- Click Confirm. Wait for 2 to 3 minutes and view the ingested metric data on the Metric Browsing page. You can view the metric ingestion rule on the Access Center > Access Management page or view metrics on the Metric Browsing page.


Step 3: Set the Tag to Be an Alarm Condition
- Check whether the cloud service metric and tag have been connected.
- In the navigation pane, choose Metric Browsing.
- On the Metric Sources tab page, select the Prometheus instance created in 3.
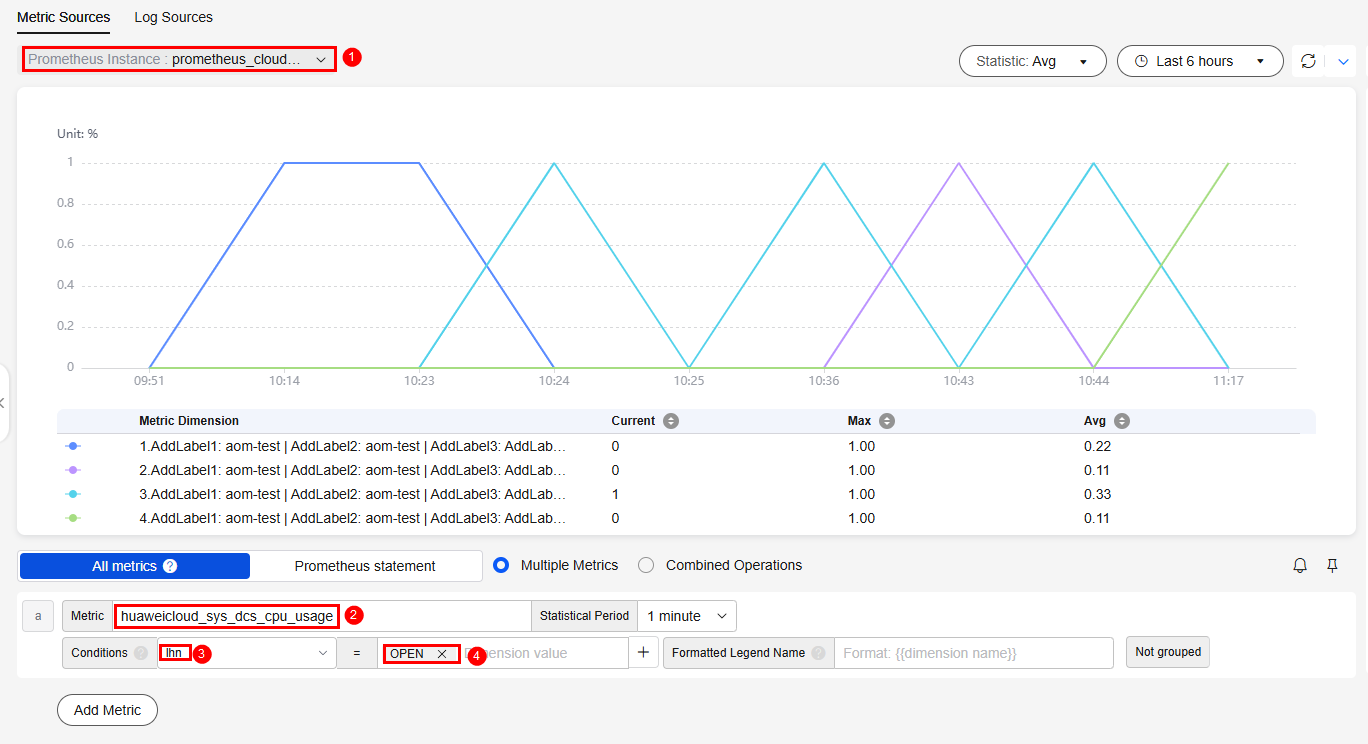
- Select the metric to be monitored from the Metric drop-down list and select the tag added in step 1 from the Conditions drop-down list to check whether the cloud service metric and tag have been connected. As shown in Figure 1, the CPU Usage metric and Ihn tag of the DCS service have been connected.
- Click Add Alarm Rule in the upper right corner of the metric list to add an alarm rule for the selected metric.
- Set the basic information about the alarm rule, such as the rule name.
Table 2 Basic information Parameter
Description
Example Value
Original Rule Name
Original name of the alarm rule. Enter a maximum of 256 characters and do not start or end with any special character. Only letters, digits, underscores (_), and hyphens (-) are allowed.
Ihn
Rule Name
Name of a rule. Max.: 256 characters. Only letters, digits, hyphens (-), and underscores (_) are allowed. Do not start or end with a hyphen or underscore. In this example, leave this parameter blank.
-
Enterprise Project
Select the required enterprise project. The default value is default.
default
Description
Description of the rule. Enter up to 1,024 characters. In this example, leave this parameter blank.
-
- Set the detailed information about the alarm rule.
- By default, the rule type, configuration mode, and Prometheus instance in the alarm rule settings are the same as those on the Metric Browsing page.
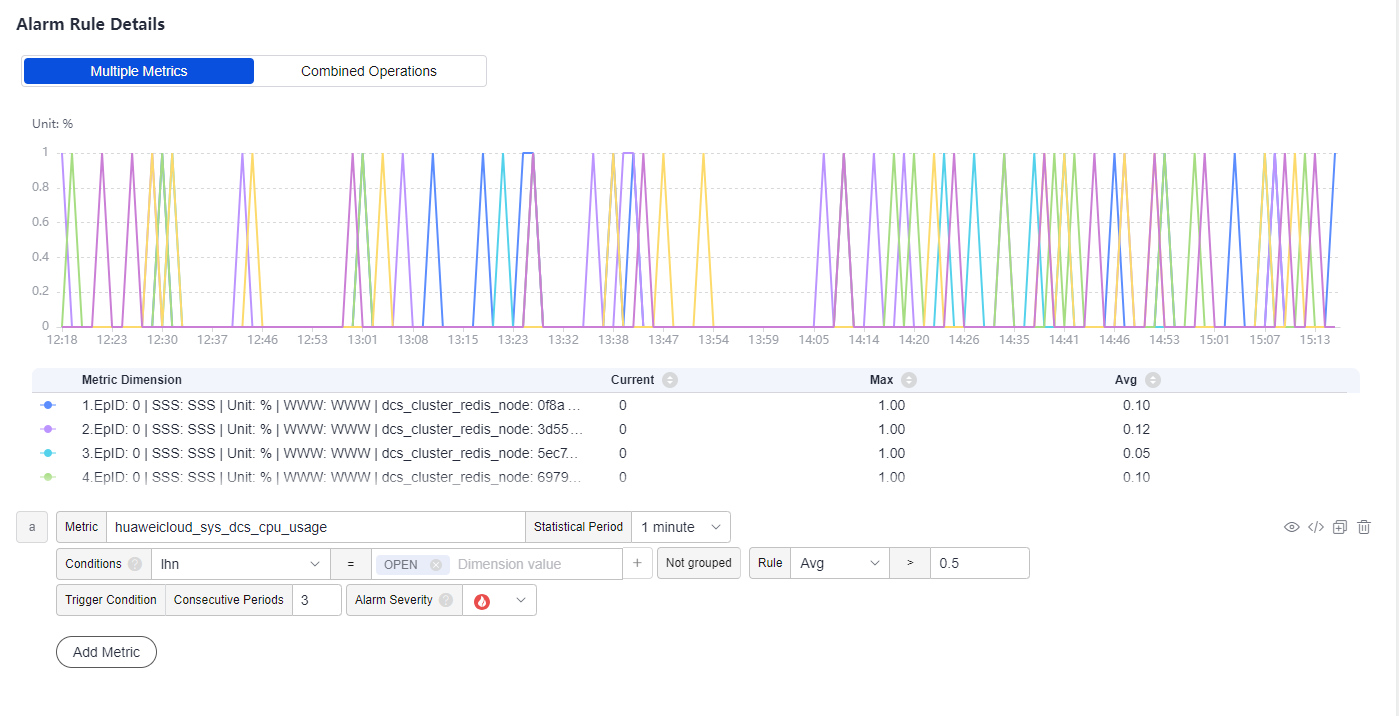
- Set alarm rule details. The metric and its conditions are consistent with those configured on the Metric Browsing page. Set parameters such as the statistical period and detection rule as required. As shown in Figure 2, in a 1-minute statistical period, if the average value of the monitored object is greater than 0.5 for three consecutive periods, a critical alarm (
 ) will be generated.
 - Under Advanced Settings, set information such as Check Interval and Alarm Clearance. In this example, retain the default settings.
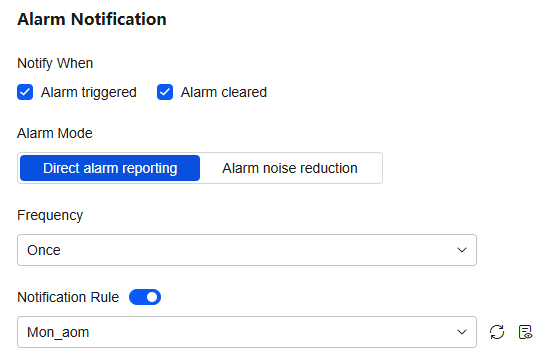
- Set an alarm notification policy. There are two alarm notification modes. As shown in Figure 3, the direct alarm reporting mode is selected. Direct alarm reporting: An alarm is directly sent when the alarm condition is met. If you select this mode, set an interval for notification and specify whether to enable a notification rule.
- Set the frequency for sending alarm notifications.
- Determine whether to enable the notification rule. After the rule is enabled, the system sends notifications based on the associated SMN topic and message template.
- Click Confirm. Then click View Rule to view the created rule.
As shown in Figure 4, click a rule name to view the rule details.
In the expanded list, if a monitored object meets the configured alarm condition, a metric alarm is generated on the alarm list page. To view the alarm, choose Alarm Center > Alarm List in the navigation pane. In this example, if the CPU usage of the DCS instance meets the preset notification policy, the system will send an alarm notification to the specified personnel by email, SMS, or WeCom.

What is your overall rating for this page?
Thank you very much for your feedback. We will continue working to improve the documentation.See the reply and handling status in My Cloud VOC.
For any further questions, feel free to contact us through the chatbot.
Chatbot


