
Viewing a Cloud Service Dashboard
Cloud Eye automatically obtains resources of cloud services connected to your account and creates dashboards for each cloud service. You can view graphs of each cloud service to learn about their running statuses. You can also set alarm rules and notifications to monitor the resource performance. If a metric surpasses its limit, Cloud Eye alerts you immediately, keeping you informed in real time.
Constraints
- CDN monitoring data is sent to Cloud Eye with a 5-minute delay, so you cannot see the latest 5 minutes of data on the graph.
- On the monitoring details page, the top N graphs cannot compare data from yesterday or last month.
- After you change the name of a cloud service, the resource name on the dashboard will be updated 12 hours later.
Procedure
- Log in to the Cloud Eye console.
- In the navigation pane, choose Cloud Service Monitoring.
- Click the name of the cloud service dashboard you want to view.
- On the cloud service monitoring details page, view service details on the Overview and Resources pages.
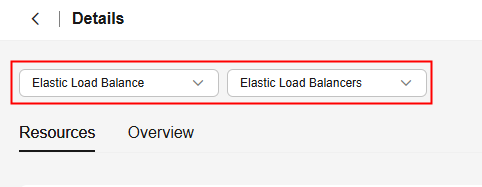
- In the upper left corner of the cloud service dashboard details page, select another dimension to view corresponding monitoring details or select another cloud service to switch to its dashboard. Figure 1 Selecting a resource dimension
- On the Resources tab, perform the following operations:
- Click Export Data to export cloud service monitoring data. For details, see Exporting Monitoring Data.
- Locate the target instance and click View Metric. On the displayed page, click View Resource Details in the upper right corner to view the resource groups that the resources belong to.
- Locate an instance and choose More > Create Alarm Rule to create an alarm rule for the instance. For details about the parameters, see Creating an Alarm Rule (New Version).
- Locate an instance and choose More > View Alarm Rule in the Operation column to view the alarm rules created for the instance.
- On the service overview page, view details under Resource Overview, Alarm Statistics, and Key Metrics. For details, see Table 1.
Table 1 Three modules on the Overview tab Module
Description
Resource Overview
You can view the resource data of the current cloud service in the current dimension, for example, you can see Total Resources, Resources With Alarms, and Resources With Alarms in the Last 7 Days.
Alarm Statistics
You can view the total number of alarms from the last seven days and the number of alarms at different severities (critical, major, minor, and warning). You can also view the top 5 instances and resource groups with the most alarms.
Key Metrics
You can view monitoring details of key metrics recommended by the cloud service.
Feedback
Was this page helpful?
Provide feedbackThank you very much for your feedback. We will continue working to improve the documentation.See the reply and handling status in My Cloud VOC.
For any further questions, feel free to contact us through the chatbot.
Chatbot


