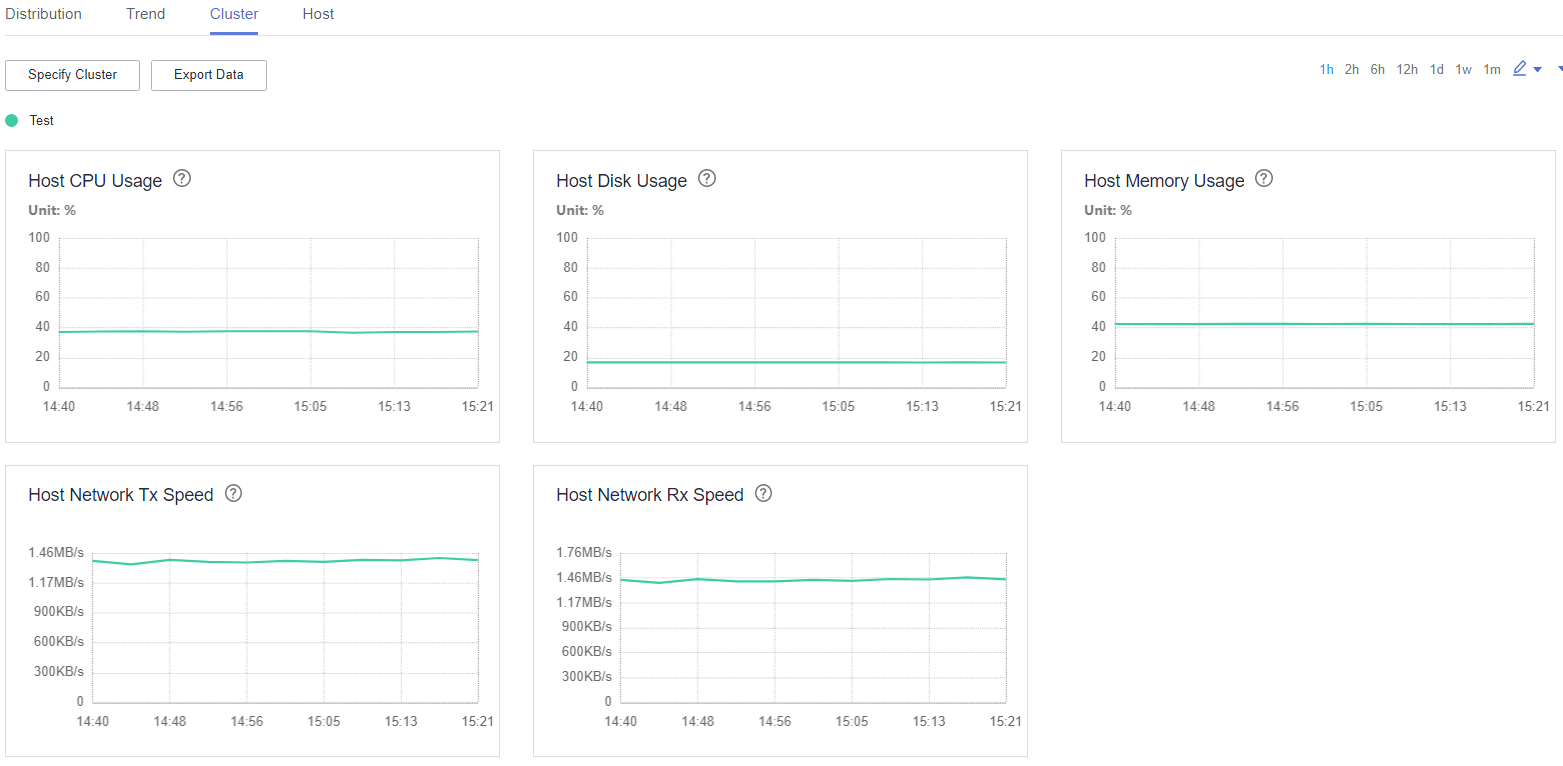
Cluster
Log in to FusionInsight Manager and choose Hosts > Resource Overview. On the Resource Overview page that is displayed, click the Cluster tab to view resource monitoring of all clusters.
By default, the monitoring data of the past one hour (1h) is displayed. You can click  to customize a time range. Time range options are 1h, 2h, 6h, 12h, 1d, 1w, and 1m.

- You can click Specify Cluster to customize a cluster to display.
- You can choose
 > Customize to customize the metrics to display on the tab page. For details about the metrics, see Table 1 in Distribution.
 - You can click Export Data to export the metric values of each cluster within the time range you have specified.
Feedback
Was this page helpful?
Provide feedbackThank you very much for your feedback. We will continue working to improve the documentation.See the reply and handling status in My Cloud VOC.
For any further questions, feel free to contact us through the chatbot.
Chatbot


