
Updated on 2025-09-15 GMT+08:00
Intelligent Database Diagnosis
DAS provides intelligent diagnosis to monitor database performance metrics and pinpoint SQL queries closely related to metric changes.
Procedure
- Log in to the console.
- Click
 in the upper left corner and select a region and project.
 - Click
 in the upper left corner. Choose Databases > Data Admin Service.
 - In the navigation pane, choose Intelligent O&M > Instance List.
Alternatively, on the Overview page, click Go to Intelligent O&M.
- In the upper right corner of the Instance List page, search for instances by engine type, instance name, or instance IP address.
- Click the Performance tab.
- AI anomaly detection
DAS detects abnormal performance metrics and marks them in red. You can focus on the anomalies during issue analysis. AI anomaly detection is enabled by default. You can toggle on or off Enable AI Anomaly Detection in the upper right corner.
Figure 1 AI anomaly detection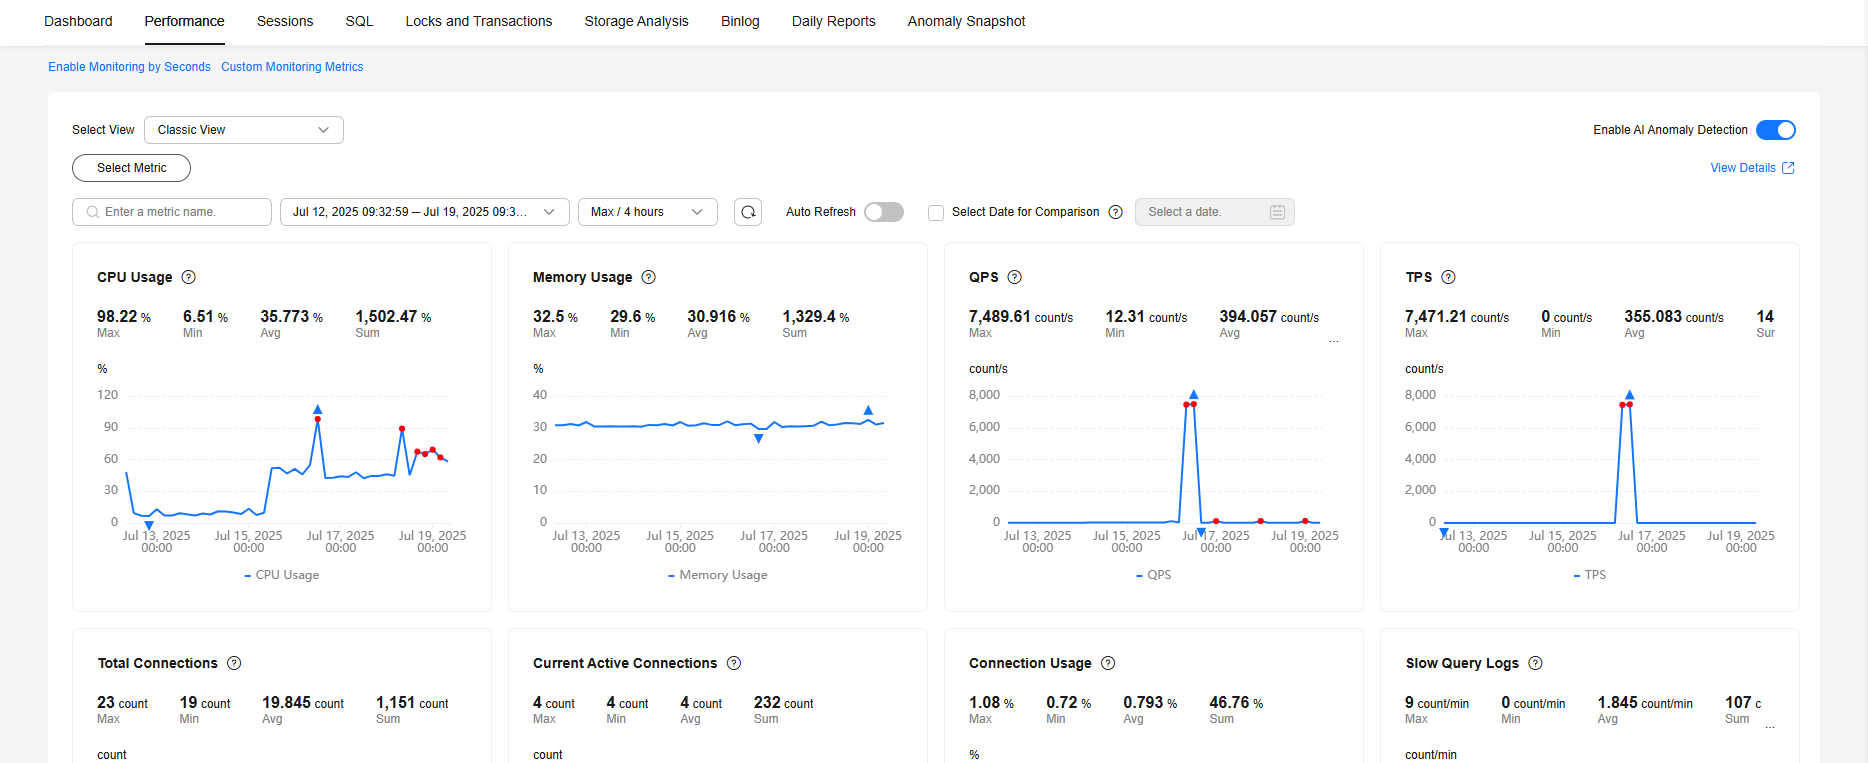
- Select a period close to the time when the anomaly occurred for fault locating and analysis.
After clicking
 , you can drag the cursor in the chart to select a period close to the time when the anomaly occurred. In the displayed dialog box, click Analyze. The analysis details page is displayed.
Figure 2 Fault locating and analysis
, you can drag the cursor in the chart to select a period close to the time when the anomaly occurred. In the displayed dialog box, click Analyze. The analysis details page is displayed.
Figure 2 Fault locating and analysis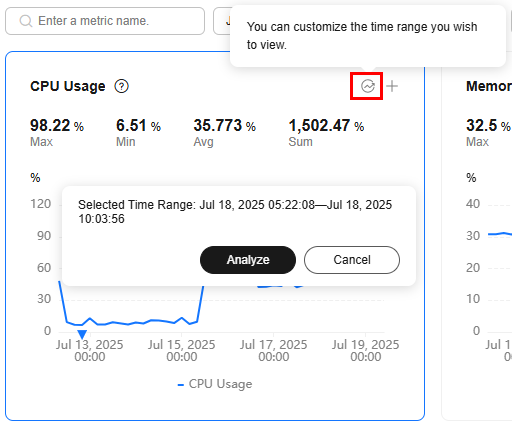 The analysis details include analysis results of risks, associated SQL queries, slow query logs, and top SQL queries. In the Associated SQL Analysis area, SQL templates closely related to metric changes are displayed.Figure 3 Analysis details
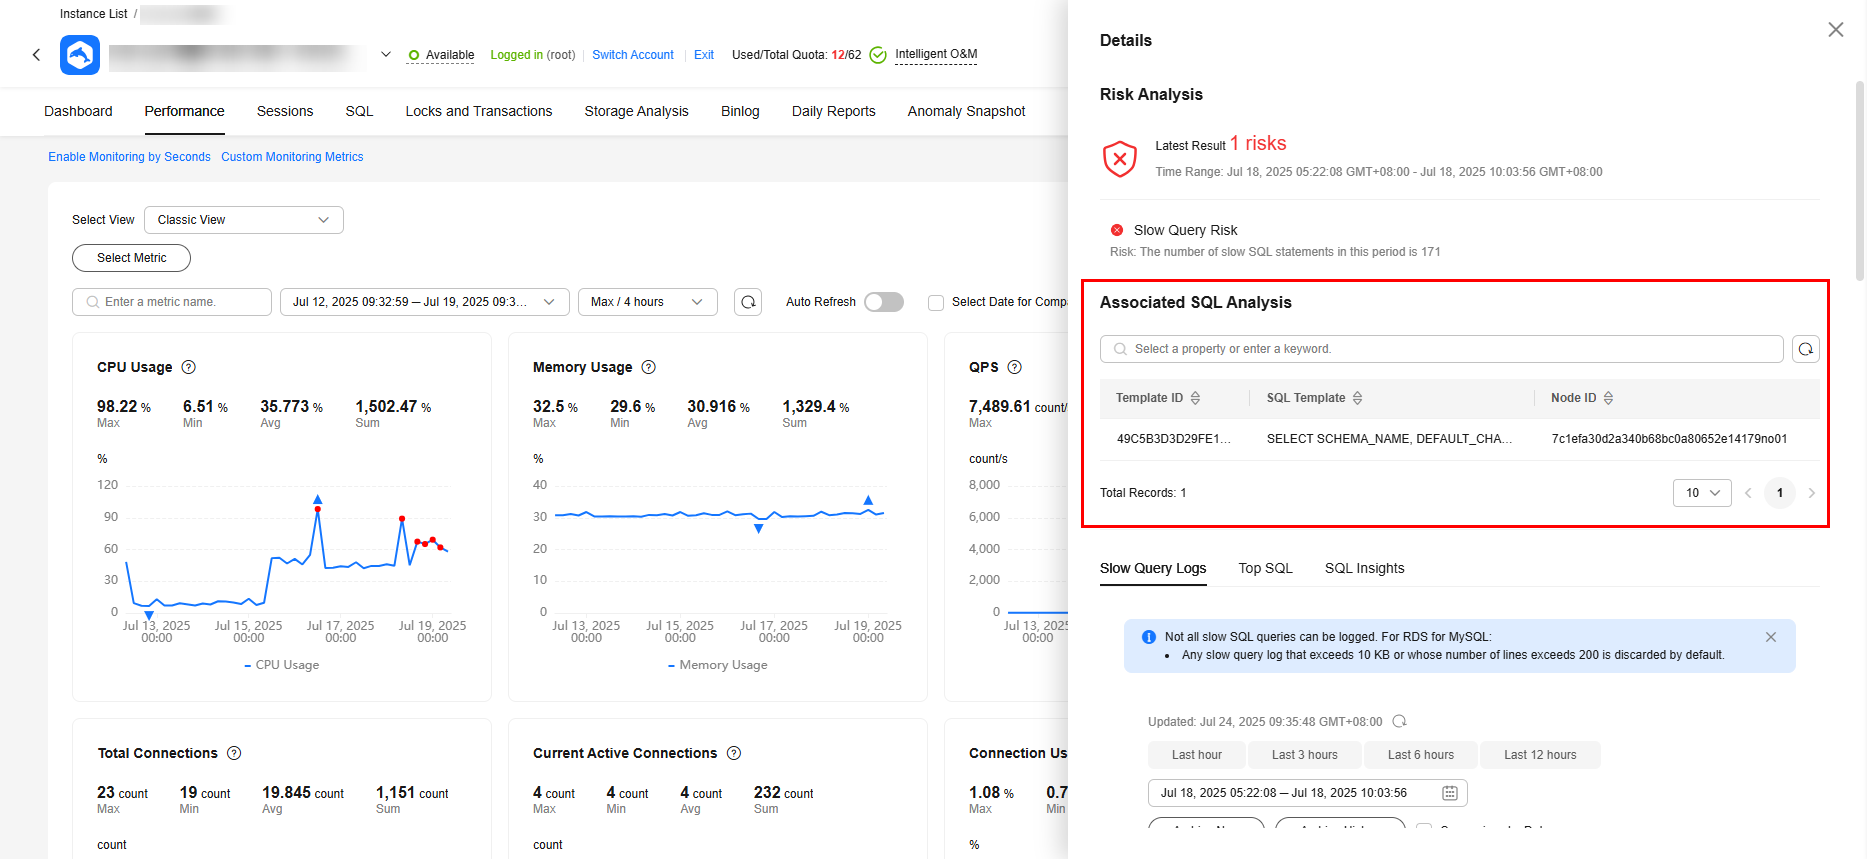
- AI anomaly detection
Feedback
Was this page helpful?
Provide feedbackThank you very much for your feedback. We will continue working to improve the documentation.See the reply and handling status in My Cloud VOC.
The system is busy. Please try again later.
For any further questions, feel free to contact us through the chatbot.
Chatbot


