
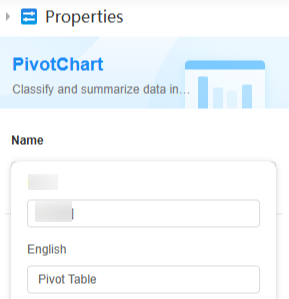
Setting the Properties of the Pivot Table Widget
This widget classifies and summarizes data across different dimensions. Set multiple dimensions (rows and columns) to display target values within each dimension.

Name
Set the widget name shown to users. Click  to set Chinese and English names.
Data
Set the data source of the widget.

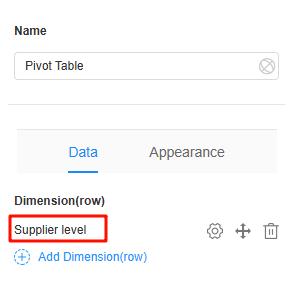
- Dimension (Row): Click Add Dimension (Row) and select the required row to add row data. Figure 4 Adding the supplier level dimension
Click
 next to a dimension to perform the following operations:
- Sorting mode: Set the sorting mode of the row dimension, for example, Default, Ascending, or Descending.
- Rename: Modify the name of an added row dimension.
- Count null value: Whether to count null values during statistics collection.
- Group: Whether to group data by Year, Month, Day, Hour, Minute, and Second during statistics collection.
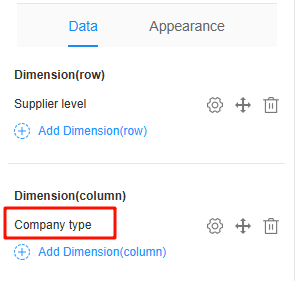
- Dimension (Column): Click Add Dimension (column) and select the required columns to add column data. Figure 5 Adding the company type dimension
Click
 next to a dimension to perform the following operations:
- Sorting mode: Set the sorting mode of the column dimension, for example, Default, Ascending, or Descending.
- Rename: Modify the name of an added column dimension.
- Count null value: Whether to count null values during statistics collection.
- Group: Whether to group data by Year, Month, Day, Hour, Minute, and Second during statistics collection.
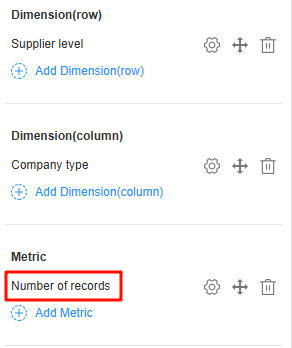
- Metric: Click Add Metric and select the required metric to add data. Figure 6 Adding records
Click
 next to a dimension to perform the following operations:
- Sorting mode: Set the sorting mode of the values, for example, Default, Ascending, or Descending.
- Rename: Modify the name of an added value.
- Count null value: Whether to count null values during statistics collection.
- Group: Whether to group data by Year, Month, Day, Hour, Minute, and Second during statistics collection.
- Chart association: If there are multiple pivot tables, you can select the associated pivot table. Figure 7 Chart association

In the primary pivot table, click a dimension. The corresponding data is displayed in the secondary pivot table. For example, if you click excellent under Supplier level in the primary pivot table, the secondary pivot table (pivot table A) automatically associates data, as shown in Figure 8.
- Data update mode > Real-time update: Whether the data in the chart needs to be updated in real time.
- Real-time update interval: Set the interval at which the data in the chart is updated. This parameter needs to be set only when the real-time update function is enabled.
- Data Filtering: Click +Add to set filter criteria. You can collect data based on the criteria. For example, filter the data whose company type is Listed company or Sole foreign investment. See Figure 10. Figure 9 No filter criteria added


Appearance
Set the appearance and style of the widget.

- Size: Set the size of the widget, for example, large, medium, or small. The default value is Large.
- Show row summary: Whether to display the row summary. This option is checked by default. Figure 12 Row summary displayed
 Figure 13 Row summary hidden
- Row summary > Name: Set the name of the row summary. Figure 14 Modifying the row summary effect

- Row summary > Summary mode: Set the row summary mode, such as Sum, Max, Min, and Average. The default value is Sum. Figure 15 Sum

- Summarize null values: Indicates whether to include null values when calculating the row average. If this option is not selected, rows with values of 0 are excluded from the average calculation. This parameter is mandatory only when the summary mode is set to Average.
- Show column summary: indicates whether to display column summary. This option is checked by default. Figure 16 Column summary displayed
 Figure 17 Column summary canceled
- Column summary > Name: Set the name of the column summary. Figure 18 Modifying the column summary effect

- Column summary > Summary mode: Set the column summary mode, such as Sum, Max, Min, and Average. The default value is Sum. Figure 19 Sum

- Summarize null values: Indicates whether to include null values when calculating the column average. If this option is not selected, columns with values of 0 are excluded from the average calculation. This parameter is mandatory only when the summary mode is set to Average.
- Freeze: Whether to freeze the dimension row or column. Currently, this parameter is valid only on PCs.
- Range color: Add color marks to data within a certain value range.
- Click the button to set rules.
If the value meets multiple condition ranges, the first condition is used by default.
- Click the button to select the corresponding value field and set the color for the field range as required. Figure 20 Setting the color matching rule for a range
 Figure 21 Setting the color rule
- Click the button to set rules.
- Conditions: If you check the Hide option, the widget is hidden on the page.
- Width: Ratio of the widget box width to the page width. Adjust the width to optimize the layout and display of the widget on the page, improving overall appearance and usability. Figure 22 Setting the widget width

- 1/4: Widget is 1/4 of the page width.
- 1/3: Widget is 1/3 of the page width.
- 1/2: Widget is 1/2 of the page width.
- 2/3: Widget is 2/3 of the page width.
- 3/4: Widget is 3/4 of the page width.
- 1: Widget is full page width (default).
Feedback
Was this page helpful?
Provide feedbackThank you very much for your feedback. We will continue working to improve the documentation.See the reply and handling status in My Cloud VOC.
For any further questions, feel free to contact us through the chatbot.
Chatbot


