
Viewing Monitoring Metrics
VOD is interconnected with Cloud Eye. You can use the console or APIs of CES to query monitoring metrics (traffic, access requests, and status code summary) and alarm information about VOD domain names.

Currently, self-service configuration on the console is not enabled. To use this function, submit a service ticket.
Namespace
SYS.VOD
Monitoring Metrics
|
ID |
Name |
Description |
Value Range |
Monitored Object |
Monitoring Interval (Raw Data) |
|---|---|---|---|---|---|
|
flux |
Traffic |
Total traffic of a domain name in a specified period of time. Unit: bit/s |
≥ 0 bit/s |
Domain name |
5 minutes |
|
req_num |
Access requests |
Number of access requests to a domain name in a specified period of time. Unit: count |
≥ 0 counts |
Domain name |
5 minutes |
|
http_code_2xx |
Status code summary 2xx |
Number of server responses to requests whose status codes are 2xx. Unit: count |
≥ 0 counts |
Domain name |
5 minutes |
|
http_code_3xx |
Status code summary 3xx |
Number of server responses to requests whose status codes are 3xx. Unit: count |
≥ 0 counts |
Domain name |
5 minutes |
|
http_code_4xx |
Status code summary 4xx |
Number of server responses to requests whose status codes are 4xx. Unit: count |
≥ 0 counts |
Domain name |
5 minutes |
|
http_code_5xx |
Status code summary 5xx |
Number of server responses to requests whose status codes are 5xx. Unit: count |
≥ 0 counts |
Domain name |
5 minutes |
Dimensions
|
Key |
Value |
|---|---|
|
domain_name |
VOD domain name |
Adding a Graph
Add a graph to monitor VOD.
- Log in to the console.
- Click
 in the upper left corner and select a region and a project.
 - Choose Service List > Cloud Eye.
You can also enter Cloud Eye in the search box of the Service List page and click the search result to go to the Cloud Eye console.
- In the navigation pane on the left, choose Dashboards > Dashboard.
- Switch to the dashboard to which you want to add a graph, and click Add Graph on the right.
- On the Add Graph page, add the monitoring metrics related to VOD to the same graph.
Figure 1 Adding a graph
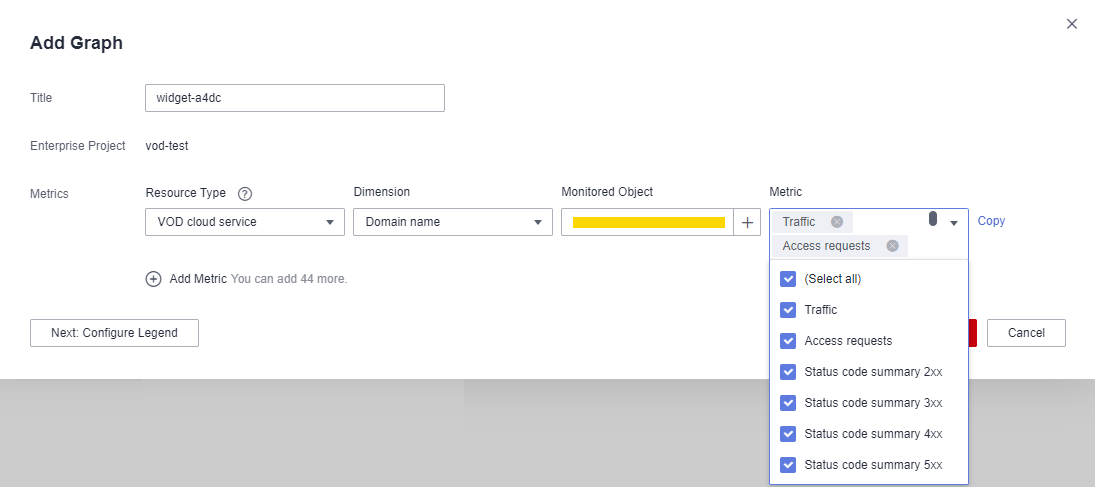
- After the monitoring metric parameters are configured, click OK.
Viewing Monitoring Metrics
View the total traffic, total access requests, and status codes of a domain name.
- Log in to the console.
- Click
 in the upper left corner and select a region and a project.
 - Choose Service List > Cloud Eye.
You can also enter Cloud Eye in the search box of the Service List page and click the search result to go to the Cloud Eye console.
- In the navigation pane on the left, choose Cloud Service Monitoring > VOD cloud service.
The Cloud Service Monitoring page is displayed.
- In the Operation column of the target resource, click View Metric.
On the monitoring metric page, view details about the total traffic, total access requests, and status codes of VOD domain names.
Figure 2 Monitoring metrics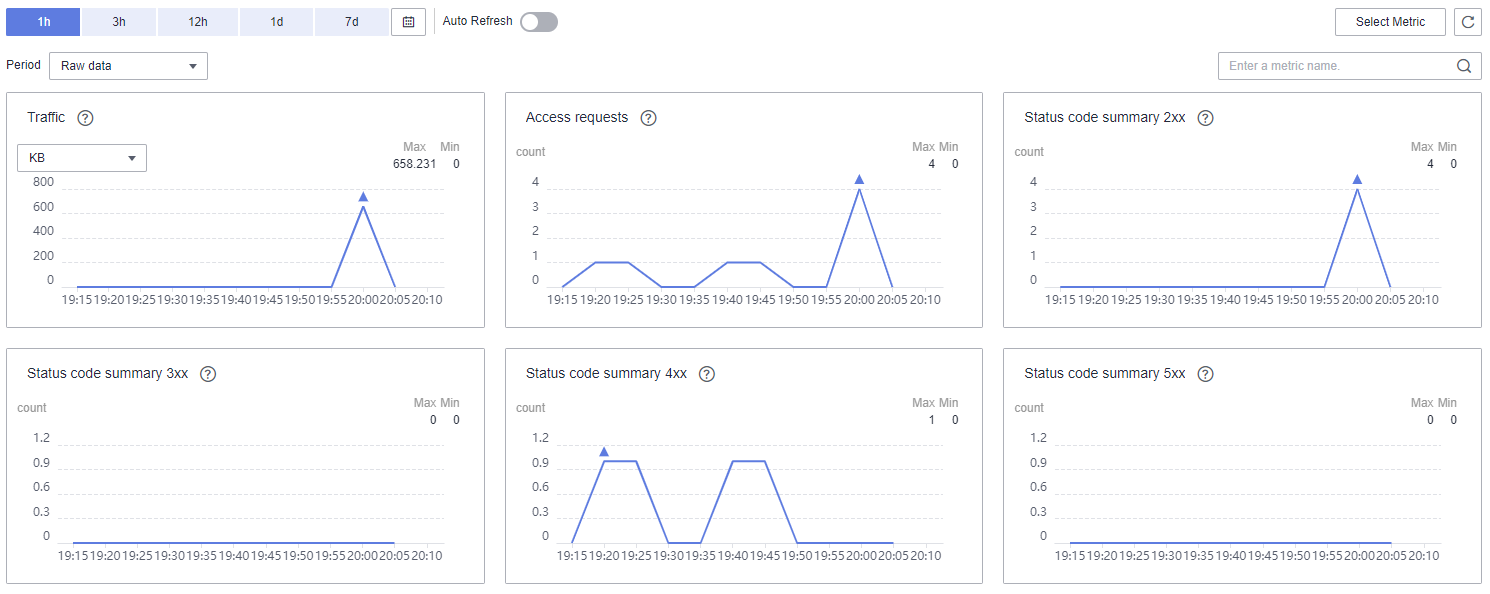
Creating an Alarm Rule
You can configure alarm rules to customize monitored objects and notification policies and to be informed of connection status at any time.
- Log in to the console.
- Click
 in the upper left corner and select a region and a project.
 - Choose Service List > Cloud Eye.
- In the navigation pane, choose Alarm Management > Alarm Rules.
- On the Alarm Rules page, click Create Alarm Rule to add an alarm rule, or select an existing alarm rule and modify it.
- After the parameters are configured, click Create.
After the alarm rule is created, the system automatically notifies you if an alarm is triggered for the VOD service.
Feedback
Was this page helpful?
Provide feedbackThank you very much for your feedback. We will continue working to improve the documentation.See the reply and handling status in My Cloud VOC.
For any further questions, feel free to contact us through the chatbot.
Chatbot


