
Distribution Statistics
The distribution statistics function of VOD allows you to query data such as the traffic, bandwidth, and traffic hit ratio on CDN.
About Query
- You can query data of the past 90 days.
- You can query data of up to 20 domain names at a time.
- The maximum time span of a query is 31 days.
- The minimum statistical granularity is 5 minutes. For example, data generated from April 2, 2019 08:00:00 (GMT+08:00) to April 2, 2019 08:04:59 (GMT+08:00) is displayed at the statistical point April 2, 2019 08:00:00 (GMT+08:00).
Procedure
- Log in to the VOD console.
- In the navigation pane on the left, choose Data Analysis > Distribution Statistics.
- On the displayed page, select Distribution traffic, Peak Distribution Bandwidth, Number of requests, Status Code, Traffic Hit Rate, or Request Hit Rate to view the statistics.
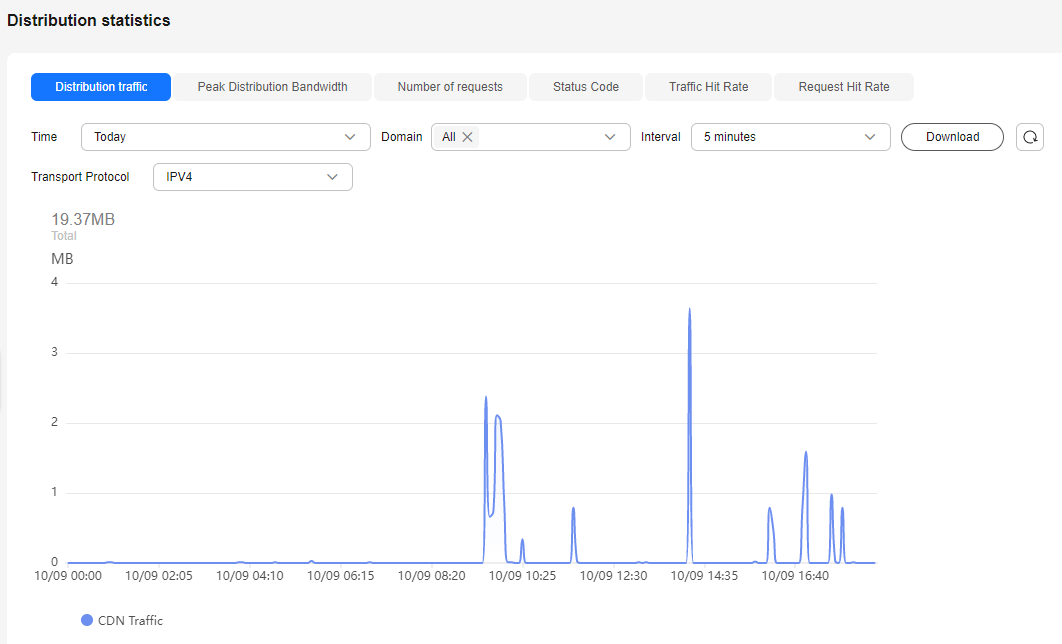
Distribution Traffic
Select Time, Domain, Interval, and Transport Protocol to view CDN traffic statistics within the specified time span, as shown in Figure 1.
Move the cursor to the trend chart and scroll the mouse wheel to zoom in or zoom out the X axis (time). You can click Download to export the statistics details to the local PC.
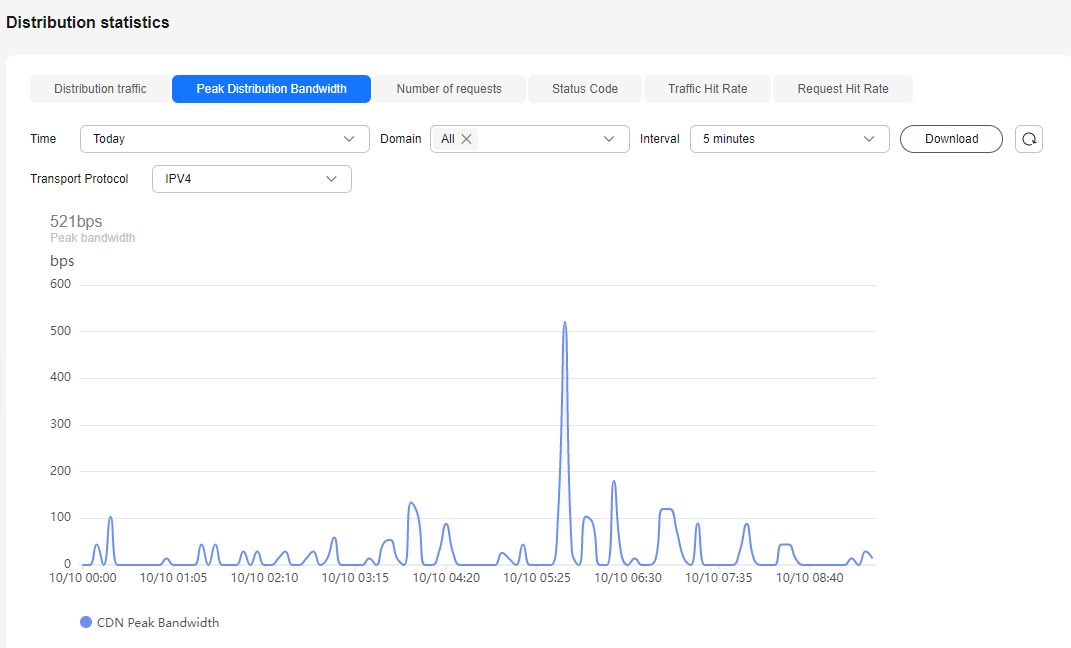
Peak Distribution Bandwidth
Select Time, Domain, Interval, and Transport Protocol to view peak CDN bandwidth statistics within the specified time span, as shown in Figure 2.
Move the cursor to the trend chart and scroll the mouse wheel to zoom in or zoom out the X axis (time). You can click Download to export the statistics details to the local PC.
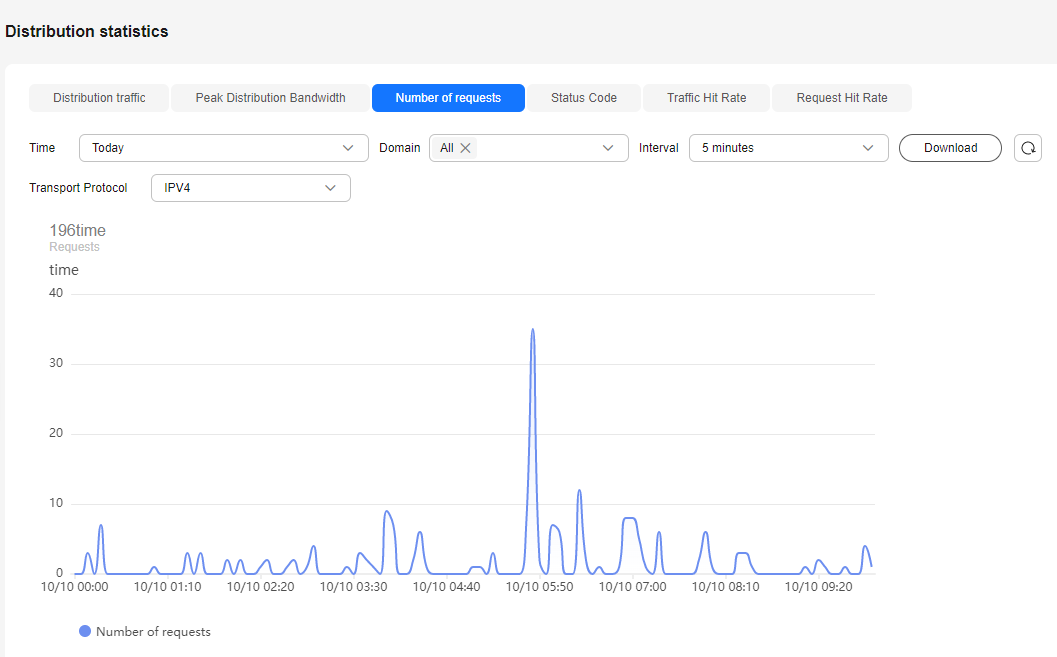
Number of Requests
Select Time, Domain, Interval, and Transport Protocol to view the number of requests within the specified time span, as shown in Figure 3.
Move the cursor to the trend chart and scroll the mouse wheel to zoom in or zoom out the X axis (time). You can click Download to export the statistics details to the local PC.
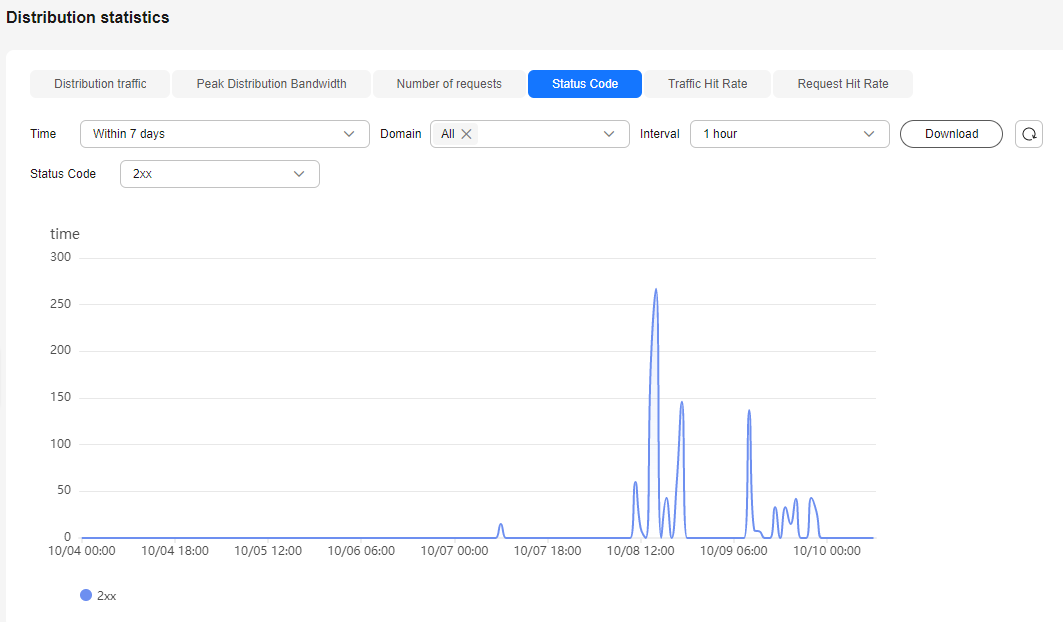
Status Codes
Select Time, Domain, Interval, and Status Code to view the number of status codes within the specified time span, as shown in Figure 4.
Move the cursor to the trend chart and scroll the mouse wheel to zoom in or zoom out the X axis (time). You can click Download to export the statistics details to the local PC.
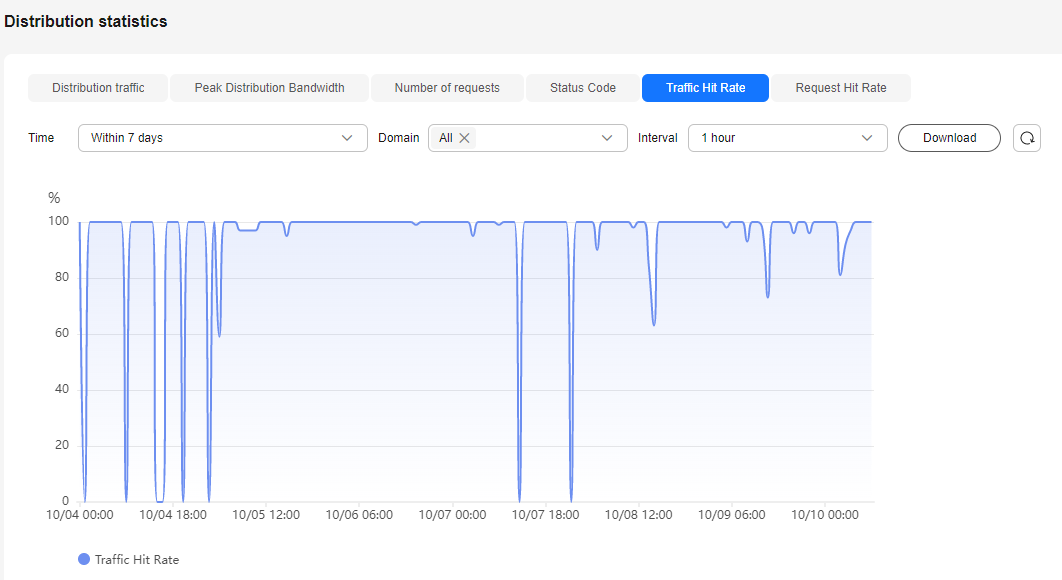
Traffic Hit Rate
Select Time, Domain, and Interval to view traffic hit rate statistics within the specified time span, as shown in Figure 5.
Traffic hit rate = Traffic consumed to hit the cache/Total traffic consumed by the requests. The total traffic consumed by the requests equals to the traffic consumed to hit the cache plus that consumed for origin pull.
Move the cursor to the trend chart and scroll the mouse wheel to zoom in or zoom out the X axis (time). You can click Download to export the statistics details to the local PC.
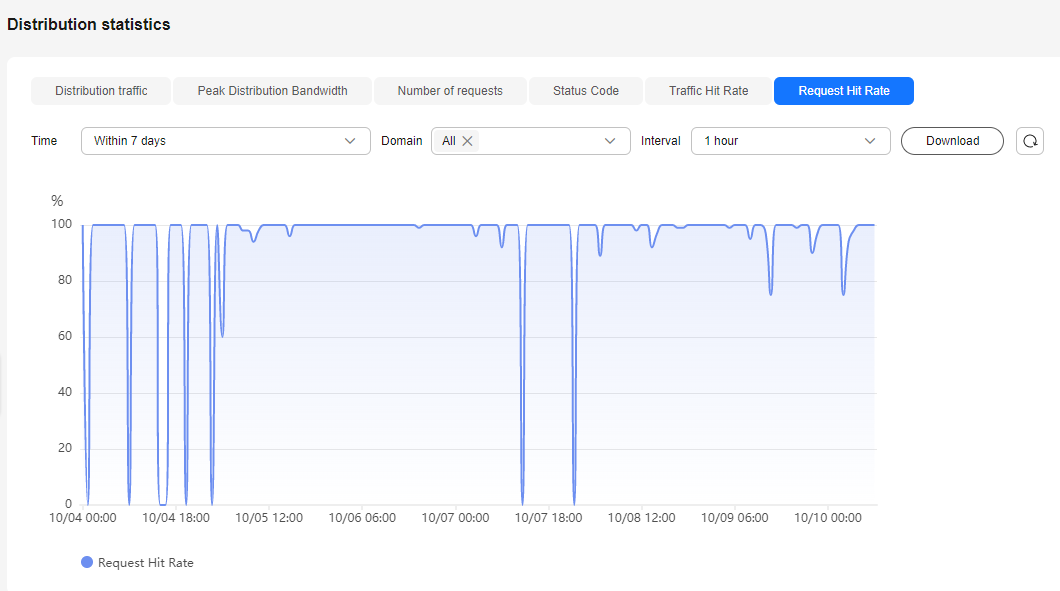
Request Hit Rate
Select Time, Domain, and Interval to view request hit rate statistics within the specified time span, as shown in Figure 6.
Request hit rate = Number of requests that hit the cache/Number of total requests
Move the cursor to the trend chart and scroll the mouse wheel to zoom in or zoom out the X axis (time). You can click Download to export the statistics details to the local PC.
Feedback
Was this page helpful?
Provide feedbackThank you very much for your feedback. We will continue working to improve the documentation.See the reply and handling status in My Cloud VOC.
For any further questions, feel free to contact us through the chatbot.
Chatbot


